Berkshire Hathaway 1998 Annual Report Download - page 39
Download and view the complete annual report
Please find page 39 of the 1998 Berkshire Hathaway annual report below. You can navigate through the pages in the report by either clicking on the pages listed below, or by using the keyword search tool below to find specific information within the annual report.-
 1
1 -
2
-
3
-
4
-
5
-
6
-
7
-
8
-
9
-
10
-
11
-
12
-
13
-
14
-
15
-
16
-
17
-
18
-
19
-
20
-
21
-
22
-
23
-
24
-
25
-
26
-
27
-
28
-
 29
29 -
 30
30 -
 31
31 -
 32
32 -
 33
33 -
 34
34 -
 35
35 -
 36
36 -
 37
37 -
 38
38 -
 39
39 -
 40
40 -
 41
41 -
 42
42 -
 43
43 -
 44
44 -
 45
45 -
 46
46 -
 47
47 -
 48
48 -
 49
49 -
50
-
51
-
52
-
53
-
54
-
55
-
56
-
57
-
58
-
59
-
60
-
61
-
62
-
63
-
64
-
65
-
66
-
67
-
68
-
69
-
70
-
71
-
72
-
73
-
74
 |
 |

38
Notes to Consolidated Financial Statements (Continued)
(12) Fair values of financial instruments (Continued)
Considerable judgement is necessarily required in interpreting market data used to develop the estimates of fair value.
Accordingly, the estimates presented herein are not necessarily indicative of the amounts the Company could realize in a
current market exchange. The use of different market assumptions and/or estimation methodologies may have a material effect
on the estimated fair value.
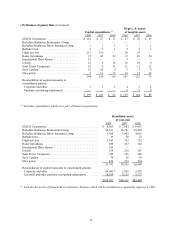
The carrying values of cash and cash equivalents, receivables and accounts payable, accruals and other liabilities are
deemed to be reasonable estimates of their fair values. The estimated fair values of the Company's other financial
instruments as of December 31, 1998 and 1997, are as follows (in millions):
Carrying Value Estimated Fair Value
1998 1997 1998 1997
Investments in securities with fixed
maturities .......................................... $21,246 $10,298 $21,246 $10,298
Investments in equity securities and other investments ......... 39,761 36,248 39,761 36,248
Assets of finance and financial products businesses ............ 16,989 1,249 17,129 1,367
Borrowings under investment agreements and
other debt .......................................... 2,385 2,267 2,475 2,262
Liabilities of finance and financial products businesses ......... 15,525 1,067 15,698 1,149
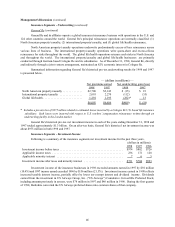
(13) Quarterly data
A summary of revenues and earnings by quarter for each of the last two years is presented in the following table. This
information is unaudited. Dollars are in millions, except per share amounts.
1st 2nd 3rd 4th
1998 Quarter Quarter Quarter Quarter
Revenues ........................................... $3,325 $3,936 $2,909 $3,662
Earnings:
Excluding realized investment gain ..................... $ 252 $ 312 $ 264 $ 449
Realized investment gain * ............................ 470 864 101 118
Net earnings ....................................... $ 722 $1,176 $ 365 $ 567
Earnings per equivalent Class A common share:
Excluding realized investment gain ..................... $ 203 $ 251 $ 212 $ 352
Realized investment gain * ............................ 379 696 81 92
Net earnings ....................................... $ 582 $ 947 $ 293 $ 444
1st 2nd 3rd 4th
1997 Quarter Quarter Quarter Quarter
Revenues ........................................... $2,075 $2,338 $2,373 $3,644
Earnings:
Excluding realized investment gain ..................... $ 263 $ 255 $248 $432
Realized investment gain * ............................ 21 23 119 540
Net earnings ....................................... $ 284 $ 278 $ 367 $ 972
Earnings per equivalent Class A common share:
Excluding realized investment gain * .................... $ 214 $ 207 $ 201 $ 350
Realized investment gain ............................. 17 19 96 438
Net earnings ....................................... $ 231 $ 226 $ 297 $ 788
*The amount of realized gain for any given period has not predictive value and variations in amount from period to period
have no practical analytical value particulary in view of the unrealized appreciation now existing in Berkshire’s
consolidated investment portfolio.