Berkshire Hathaway 1998 Annual Report Download - page 4
Download and view the complete annual report
Please find page 4 of the 1998 Berkshire Hathaway annual report below. You can navigate through the pages in the report by either clicking on the pages listed below, or by using the keyword search tool below to find specific information within the annual report.-
 1
1 -
 2
2 -
 3
3 -
 4
4 -
 5
5 -
 6
6 -
 7
7 -
 8
8 -
 9
9 -
 10
10 -
 11
11 -
 12
12 -
 13
13 -
 14
14 -
 15
15 -
16
-
17
-
18
-
19
-
20
-
21
-
22
-
23
-
24
-
25
-
26
-
27
-
28
-
29
-
30
-
31
-
32
-
33
-
34
-
35
-
36
-
37
-
38
-
39
-
40
-
41
-
42
-
43
-
44
-
45
-
46
-
47
-
48
-
49
-
50
-
51
-
52
-
53
-
54
-
55
-
56
-
57
-
58
-
59
-
60
-
61
-
62
-
63
-
64
-
65
-
66
-
67
-
68
-
69
-
70
-
71
-
72
-
73
-
74
 |
 |

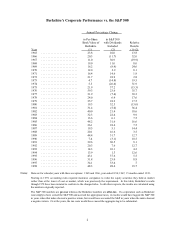
*All figures used in this report apply to Berkshire's A shares, the successor to the only stock that the company
had outstanding before 1996. The B shares have an economic interest equal to 1/30th that of the A.
3
BERKSHIRE HATHAWAY INC.
To the Shareholders of Berkshire Hathaway Inc.:
Our gain in net worth during 1998 was $25.9 billion, which increased the per-share book value of both our Class
A and Class B stock by 48.3%. Over the last 34 years (that is, since present management took over) per-share book value
has grown from $19 to $37,801, a rate of 24.7% compounded annually.*
Normally, a gain of 48.3% would call for handsprings — but not this year. Remember Wagner, whose music
has been described as better than it sounds? Well, Berkshire’s progress in 1998 — though more than satisfactory — was not
as good as it looks. That’s because most of that 48.3% gain came from our issuing shares in acquisitions.
To explain: Our stock sells at a large premium over book value, which means that any issuing of shares we do
— whether for cash or as consideration in a merger — instantly increases our per-share book-value figure, even though
we’ve earned not a dime. What h appens is that we get more per-share book value in such transactions than we give up.
These transactions, however, do not deliver us any immediate gain in per-share intrinsic value, because in this respect
what we give and what we get are roughly equal. And, as Charlie Munger, Berkshire’s Vice Chairman and my partner,
and I can’t tell you too often (though you may feel that we try ), it’s the per-share gain in intrinsic value that counts rather
than the per-share gain in book value. Though Berkshire’s intrinsic value grew very substantially in 1998, the gain fell
well short of the 48.3% recorded for book value. Nevertheless, intrinsic value still far exceeds book value. (For a more
extensive discussion of these terms, and other investment and accounting concepts, please refer to our Owner’s Manual,
on pages 56-64, in which we set forth our owner-related business principles. Intrinsic value is discussed on pages 61 and
62.)
We entered 1999 with the best collection of businesses and managers in our history. The two companies we
acquired in 1998, General Re and Executive Jet, are first-class in every way — more about both later — and the
performance of our operating businesses last year exceeded my hopes. GEICO, once again, simply shot the lights out.
On the minus side, several of the public companies in which we have major investments experienced significant operating
shortfalls that neither they nor I anticipated early in the year. Consequently, our equity portfolio did not perform nearly
as well as did the S&P 500. The problems of these companies are almost certainly temporary, and Charlie and I believe
that their long-term prospects are excellent.
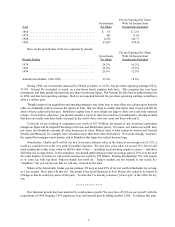
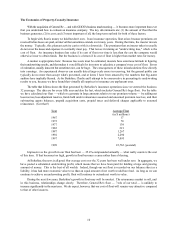
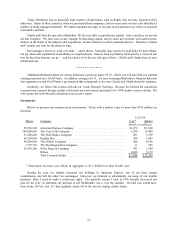
In our last three annual reports, we furnished you a table that we regard as central to estimating Berkshire's
intrinsic value. In the updated version of that table, which follows, we trace our two key components of value, including
General Re on a pro-forma basis as if we had owned it throughout the year. The first column lists our per-share
ownership of investments (including cash and equivalents but excluding securities held in our financial products
operation) and the second column shows our per-share earnings from Berkshire's operating businesses before taxes and
purchase-accounting adjustments (discussed on pages 62 and 63), but after all interest and corporate expenses. The
second column excludes all dividends, interest and capital gains that we realized from the investments presented in the
first column. In effect, the columns show how Berkshire would look if it were split into two parts, with one entity holding
our investments and the other operating all of our businesses and bearing all corporate costs.