Berkshire Hathaway 1998 Annual Report Download - page 51
Download and view the complete annual report
Please find page 51 of the 1998 Berkshire Hathaway annual report below. You can navigate through the pages in the report by either clicking on the pages listed below, or by using the keyword search tool below to find specific information within the annual report.-
 1
1 -
2
-
3
-
4
-
5
-
6
-
7
-
8
-
9
-
10
-
11
-
12
-
13
-
14
-
15
-
16
-
17
-
18
-
19
-
20
-
21
-
22
-
23
-
24
-
25
-
26
-
27
-
28
-
29
-
30
-
31
-
32
-
33
-
34
-
35
-
36
-
37
-
38
-
39
-
40
-
 41
41 -
 42
42 -
 43
43 -
 44
44 -
 45
45 -
 46
46 -
 47
47 -
 48
48 -
 49
49 -
 50
50 -
 51
51 -
 52
52 -
 53
53 -
 54
54 -
 55
55 -
 56
56 -
 57
57 -
 58
58 -
 59
59 -
 60
60 -
 61
61 -
62
-
63
-
64
-
65
-
66
-
67
-
68
-
69
-
70
-
71
-
72
-
73
-
74
 |
 |

50
Management's Discussion (Continued)
Market Risk Disclosures
Berkshire's Consolidated Balance Sheet includes a substantial amount of assets and liabilities whose fair
values are subject to market risks. Due to Berkshire's significant level of investments in equity securities, fluctuations
in equity prices represent the largest market risk factor affecting Berkshire's consolidated financial position. The
following sections address the significant market risks associated with Berkshire's business activities as of year end
1998 and 1997.
Equity Price Risk
Strategically, Berkshire strives to invest in businesses that possess excellent economics, with able and honest
management and at sensible prices. Berkshire's management prefers to invest a meaningful amount in each investee.
Accordingly, Berkshire's equity investments are concentrated in relatively few investees. At year-end 1998 and 1997,
approximately 60% of the total fair value of investments in equity securities was concentrated in three investees.
Berkshire's primary investment strategy contemplates that most equity investments will be held for very long
periods of time. Thus, Berkshire management is not necessarily troubled by short term price volatility with respect
to its investments provided that the underlying business, economic and management characteristics of the investees
remain favorable. Berkshire maintains above average levels of shareholder capital to provide a margin of safety against
short term equity price volatility.
The carrying values of investments subject to equity price risks are based on quoted market prices or
management's estimates of fair value as of the balance sheet dates. Market prices are subject to fluctuation and,
consequently, the amount realized in the subsequent sale of an investment may significantly differ from the reported
market value. Fluctuation in the market price of a security may result from perceived changes in the underlying
economic characteristics of the investee, the relative price of alternative investments and general market conditions.
Furthermore, amounts realized in the sale of a particular security may be affected by the relative quantity of the security
being sold.
In addition to its equity investments, Berkshire's obligations with respect to the 1% Senior Exchangeable
Notes are subject to equity price risks. See Note 9 to the Consolidated Financial Statements for information regarding
the Exchange Notes. As of year-end 1998 and 1997, the market price of Citigroup common stock far exceeded the
current exchange price of the Exchange Notes. Therefore, the fair values of the Exchange Notes are primarily subject
to equity price risk.
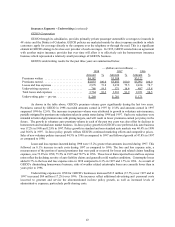
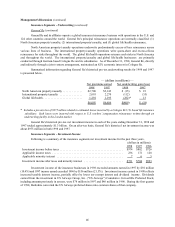
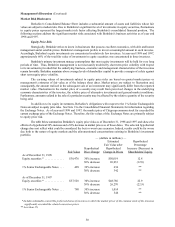
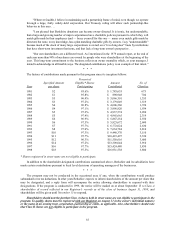
The table below summarizes Berkshire's equity price risks as of December 31, 1998 and 1997 and shows the
effects of a hypothetical 30% increase and a 30% decrease in market prices as of those dates. The selected hypothetical
change does not reflect what could be considered the best or worst case scenarios. Indeed, results could be far worse
due both to the nature of equity markets and the aforementioned concentrations existing in Berkshire's investment
portfolio.
— (dollars in millions) —
Estimated Hypothetical
Fair Value after Percentage
Hypothetical Hypothetical Increase (Decrease) in
Fair Value Price Change Change in Prices Shareholders’ Equity
As of December 31, 1998
Equity securities * ............. $38,476 30% increase $50,019 12.8
30% decrease 26,933 (12.8)
1% Senior Exchangeable Notes ... 489 30% increase 636 **
30% decrease 342 **
As of December 31, 1997
Equity securities * ............. $37,528 30% increase $48,786 22.9
30% decrease 26,270 (22.9)
1% Senior Exchangeable Notes ... 780 30% increase 1,014 **
30% decrease 546 **
** Includes redeemable convertible preferred shares of investees in which the market prices of the common stock of the investees
** significantly exceeded the related conversion prices.
** Less than 1%