AutoZone 2010 Annual Report Download - page 50
Download and view the complete annual report
Please find page 50 of the 2010 AutoZone annual report below. You can navigate through the pages in the report by either clicking on the pages listed below, or by using the keyword search tool below to find specific information within the annual report.-
 1
1 -
2
-
3
-
4
-
5
-
6
-
7
-
8
-
9
-
10
-
11
-
12
-
13
-
14
-
15
-
16
-
17
-
18
-
19
-
20
-
21
-
22
-
23
-
24
-
25
-
26
-
27
-
28
-
29
-
30
-
31
-
32
-
33
-
34
-
35
-
36
-
37
-
38
-
39
-
 40
40 -
 41
41 -
 42
42 -
 43
43 -
 44
44 -
 45
45 -
 46
46 -
 47
47 -
 48
48 -
 49
49 -
 50
50 -
 51
51 -
 52
52 -
 53
53 -
 54
54 -
 55
55 -
 56
56 -
 57
57 -
 58
58 -
 59
59 -
 60
60 -
61
-
62
-
63
-
64
-
65
-
66
-
67
-
68
-
69
-
70
-
71
-
72
-
73
-
74
-
75
-
76
-
77
-
78
-
79
-
80
-
81
-
82
-
83
-
84
-
85
-
86
-
87
-
88
-
89
-
90
-
91
-
92
-
93
-
94
-
95
-
96
-
97
-
98
-
99
-
100
-
101
-
102
-
103
-
104
-
105
-
106
-
107
-
108
-
109
-
110
-
111
-
112
-
113
-
114
-
115
-
116
-
117
-
118
-
119
-
120
-
121
-
122
-
123
-
124
-
125
-
126
-
127
-
128
-
129
-
130
-
131
-
132
-
133
-
134
-
135
-
136
-
137
-
138
-
139
-
140
-
141
-
142
-
143
-
144
-
145
-
146
-
147
-
148
-
149
-
150
-
151
-
152
-
153
-
154
-
155
-
156
-
157
-
158
-
159
-
160
-
161
-
162
-
163
-
164
-
165
-
166
-
167
-
168
-
169
-
170
-
171
-
172
 |
 |

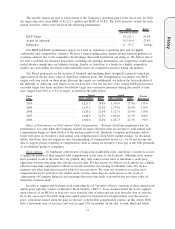
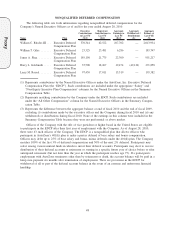
SUMMARY COMPENSATION TABLE
This table shows the compensation paid to the Principal Executive Officer, the Principal Financial Officer
and our other three most highly paid executive officers (the “Named Executive Officers”).
Name and Principal Position Year
Salary
($)
Bonus
($)(1)
Stock
Awards
($)(2)(3)
Option
Awards
($)(3)
Non-Equity
Incentive Plan
Compensation
($)(4)
Change in
Pension Value
& Non-qualified
Deferred
Compensation
Earnings
($)(5)
All Other
Compensation
($)(6)
Total
($)
William C. Rhodes III ......... 2010 920,923 — 21,335 1,159,974 1,572,937 — 134,758 3,809,927
Chairman, President & 2009 752,385 — 21,270 1,138,717 1,017,977 — 122,416 3,052,765
Chief Executive Officer 2008 706,019 — 20,211 1,270,084 779,446 — 111,193 2,886,953
William T. Giles ............. 2010 472,692 — 4,426 678,800 605,519 — 53,030 1,814,467
Executive Vice President, 2009 458,308 — 5,858 654,762 372,055 — 39,754 1,530,737
Finance, IT & Store Development 2008 455,865 — 4,557 730,298 301,966 — 228,605 1,721,291
Chief Financial Officer
James A. Shea .............. 2010 440,000 — — 678,800 563,640 — 46,943 1,729,383
Executive Vice President, 2009 443,154 — — 654,762 359,752 — 47,807 1,505,475
Merchandising, Marketing & 2008 439,558 — — 730,298 291,164 — 39,345 1,500,365
Supply Chain
Harry L. Goldsmith .......... 2010 398,000 — 3,478 622,949 509,838 — 58,163 1,592,428
Executive Vice President, 2009 385,154 — 3,487 597,826 312,668 — 48,871 1,348,006
General Counsel & Secretary 2008 380,596 — 3,477 666,794 252,107 — 41,651 1,344,625
Larry M. Roesel ............. 2010 376,346 — — 515,544 385,681 — 40,268 1,317,839
Senior Vice President,
Commercial
(1) Annual incentive awards were paid pursuant to the EICP and therefore appear in the “non-equity incentive
plan compensation” column of the table.
(2) Represents shares acquired pursuant to the Executive Stock Purchase Plan. See “Compensation Discussion
and Analysis” on page 28 for more information about this plan. See Note B, Share-Based Payments, to
our consolidated financial statements in our 2010 Annual Report for a description of the Executive Stock
Purchase Plan and the accounting and assumptions used in calculating expenses in accordance with FASB
ASC Topic 718.
(3) The value of stock awards and option awards was determined as required by FASB ASC Topic 718. There
is no assurance that these values will be realized. See Note B, Share-Based Payments, to our consolidated
financial statements in our 2010 Annual Report for details on assumptions used in the valuation.
(4) Incentive amounts were earned for the 2010 fiscal year pursuant to the EICP and were paid in October,
2010. See “Compensation Discussion and Analysis” on page 28 for more information about this plan.
(5) Our defined benefit pension plans were frozen in December 2002, and accordingly, benefits do not
increase or decrease. See the Pension Benefits table on page 46 for more information. We did not provide
above-market or preferential earnings on deferred compensation in 2008, 2009 or 2010.
40
Proxy