AutoZone 2010 Annual Report Download - page 117
Download and view the complete annual report
Please find page 117 of the 2010 AutoZone annual report below. You can navigate through the pages in the report by either clicking on the pages listed below, or by using the keyword search tool below to find specific information within the annual report.-
 1
1 -
2
-
3
-
4
-
5
-
6
-
7
-
8
-
9
-
10
-
11
-
12
-
13
-
14
-
15
-
16
-
17
-
18
-
19
-
20
-
21
-
22
-
23
-
24
-
25
-
26
-
27
-
28
-
29
-
30
-
31
-
32
-
33
-
34
-
35
-
36
-
37
-
38
-
39
-
40
-
41
-
42
-
43
-
44
-
45
-
46
-
47
-
48
-
49
-
50
-
51
-
52
-
53
-
54
-
55
-
56
-
57
-
58
-
59
-
60
-
61
-
62
-
63
-
64
-
65
-
66
-
67
-
68
-
69
-
70
-
71
-
72
-
73
-
74
-
75
-
76
-
77
-
78
-
79
-
80
-
81
-
82
-
83
-
84
-
85
-
86
-
87
-
88
-
89
-
90
-
91
-
92
-
93
-
94
-
95
-
96
-
97
-
98
-
99
-
100
-
101
-
102
-
103
-
104
-
105
-
106
-
 107
107 -
 108
108 -
 109
109 -
 110
110 -
 111
111 -
 112
112 -
 113
113 -
 114
114 -
 115
115 -
 116
116 -
 117
117 -
 118
118 -
 119
119 -
 120
120 -
 121
121 -
 122
122 -
 123
123 -
 124
124 -
 125
125 -
 126
126 -
 127
127 -
128
-
129
-
130
-
131
-
132
-
133
-
134
-
135
-
136
-
137
-
138
-
139
-
140
-
141
-
142
-
143
-
144
-
145
-
146
-
147
-
148
-
149
-
150
-
151
-
152
-
153
-
154
-
155
-
156
-
157
-
158
-
159
-
160
-
161
-
162
-
163
-
164
-
165
-
166
-
167
-
168
-
169
-
170
-
171
-
172
 |
 |

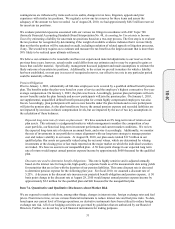
optimum capital structure and are used to assist management in evaluating performance and in making
appropriate business decisions to maximize stockholders’ value.
Non-GAAP financial measures should not be used as a substitute for GAAP financial measures, or considered
in isolation, for the purpose of analyzing our operating performance, financial position or cash flows. However,
we have presented the non-GAAP financial measures, as we believe they provide additional information that is
useful to investors as it indicates more clearly our comparative year-to-year operating results. Furthermore, our
management and Compensation Committee of the Board of Directors use the above-mentioned non-GAAP
financial measures to analyze and compare our underlying operating results and to determine payments of
performance-based compensation. We have included a reconciliation of this information to the most compara-
ble GAAP measures in the following reconciliation tables.
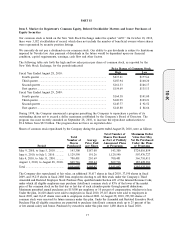
Reconciliation of Non-GAAP Financial Measure: Cash Flow Before Share Repurchases and Changes in Debt
The following table reconciles net increase (decrease) in cash and cash equivalents to cash flow before share
repurchases and changes in debt, which is presented in “Selected Financial Data”:
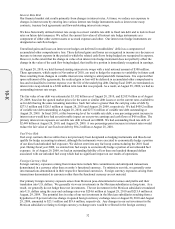
(in thousands) 2010 2009 2008 2007 2006
Fiscal Year Ended August
Net increase (decrease) in cash and cash
equivalents ............................................ $ 5,574 $ (149,755) $ 155,807 $ (4,904) $ 16,748
Less: Increase (decrease) in debt............. 181,586 476,900 314,382 78,461 (4,693)
Less: Share repurchases ........................... (1,123,655) (1,300,002) (849,196) (761,887) (578,066)
Cash flow before share repurchases and
changes in debt..................................... $ 947,643 $ 673,347 $ 690,621 $ 678,522 $ 599,507
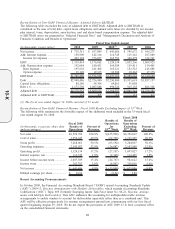
Reconciliation of Non-GAAP Financial Measure: After-tax Return on Invested Capital
The following table reconciles the percentages of ROIC. ROIC is calculated as after-tax operating profit
(excluding rent) divided by average invested capital (which includes a factor to capitalize operating leases).
The ROIC percentages are presented in “Selected Financial Data” and “Management’s Discussion and Analysis
of Financial Condition and Results of Operations”:
(in thousands, except percentages) 2010 2009 2008
(1)
2007 2006
Fiscal Year Ended August
Net income ............................................. $ 738,311 $ 657,049 $ 641,606 $ 595,672 $ 569,275
Adjustments:
Interest expense ................................. 158,909 142,316 116,745 119,116 107,889
Rent expense ...................................... 195,632 181,308 165,121 152,523 143,888
Tax effect
(2)
........................................ (128,983) (117,929) (102,345) (98,796) (92,880)
After-tax return ...................................... $ 963,869 $ 862,744 $ 821,127 $ 768,515 $ 728,172
Average debt
(3)
....................................... $2,769,617 $2,468,351 $2,074,738 $1,888,989 $1,822,642
Average (deficit) equity
(4)
..................... (507,885) (75,162) 308,401 482,702 518,303
Rent x 6
(5)
.............................................. 1,173,792 1,087,848 990,726 915,138 863,328
Average capital lease obligations
(6)
....... 62,220 58,901 60,763 27,093 —
Pre-tax invested capital.......................... $3,497,744 $3,539,938 $3,434,628 $3,313,922 $3,204,273
ROIC ...................................................... 27.6% 24.4% 23.9% 23.2% 22.7%
(1) The fiscal year ended August 30, 2008 consisted of 53 weeks.
(2) The effective tax rate during fiscal 2010, fiscal 2009, fiscal 2008, fiscal 2007 and fiscal 2006 was 36.4%,
36.4%, 36.3%, 36.4% and 36.9% respectively.
(3) Average debt is equal to the average of our debt measured as of the previous five quarters.
(4) Average equity is equal to the average of our stockholders’ (deficit) equity measured as of the previous five
quarters.
(5) Rent is multiplied by a factor of six to capitalize operating leases in the determination of pre-tax invested
capital.
(6) Average capital lease obligations relating to vehicle capital leases entered into at the beginning of fiscal
2007 is computed as the average over the trailing five quarters. Rent expense associated with the vehicles
prior to the conversion to capital leases is included in the rent for purposes of calculating return on
invested capital.
27
10-K