AutoZone 2010 Annual Report Download - page 111
Download and view the complete annual report
Please find page 111 of the 2010 AutoZone annual report below. You can navigate through the pages in the report by either clicking on the pages listed below, or by using the keyword search tool below to find specific information within the annual report.-
 1
1 -
2
-
3
-
4
-
5
-
6
-
7
-
8
-
9
-
10
-
11
-
12
-
13
-
14
-
15
-
16
-
17
-
18
-
19
-
20
-
21
-
22
-
23
-
24
-
25
-
26
-
27
-
28
-
29
-
30
-
31
-
32
-
33
-
34
-
35
-
36
-
37
-
38
-
39
-
40
-
41
-
42
-
43
-
44
-
45
-
46
-
47
-
48
-
49
-
50
-
51
-
52
-
53
-
54
-
55
-
56
-
57
-
58
-
59
-
60
-
61
-
62
-
63
-
64
-
65
-
66
-
67
-
68
-
69
-
70
-
71
-
72
-
73
-
74
-
75
-
76
-
77
-
78
-
79
-
80
-
81
-
82
-
83
-
84
-
85
-
86
-
87
-
88
-
89
-
90
-
91
-
92
-
93
-
94
-
95
-
96
-
97
-
98
-
99
-
100
-
 101
101 -
 102
102 -
 103
103 -
 104
104 -
 105
105 -
 106
106 -
 107
107 -
 108
108 -
 109
109 -
 110
110 -
 111
111 -
 112
112 -
 113
113 -
 114
114 -
 115
115 -
 116
116 -
 117
117 -
 118
118 -
 119
119 -
 120
120 -
 121
121 -
122
-
123
-
124
-
125
-
126
-
127
-
128
-
129
-
130
-
131
-
132
-
133
-
134
-
135
-
136
-
137
-
138
-
139
-
140
-
141
-
142
-
143
-
144
-
145
-
146
-
147
-
148
-
149
-
150
-
151
-
152
-
153
-
154
-
155
-
156
-
157
-
158
-
159
-
160
-
161
-
162
-
163
-
164
-
165
-
166
-
167
-
168
-
169
-
170
-
171
-
172
 |
 |

Miles Driven
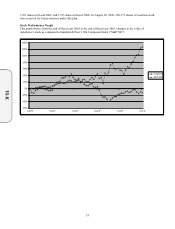
We believe that as the number of miles driven increases, consumers’ vehicles are more likely to need service and
maintenance, resulting in an increase in the need for automotive hard parts and maintenance items. Prior to the
recession, we had seen a close correlation between annual miles driven and our annual net sales; however, this
correlation has not existed in the recent short-term recessionary period. Since the beginning of the fiscal year and
through July 2010 (latest publicly available information), miles driven were relatively flat as compared to the
comparable prior year period. Throughout this period and contrary to the correlation experienced prior to the
recession, sales have grown at an increased rate, while miles driven have grown at a slower rate than what we
have historically experienced. We believe that the impact of changes in other factors, primarily an increase in
seven year old or older vehicles, more than offset the impact of miles driven. As the economy continues to
recover, we believe that annual miles driven will return to pre-recession low single digit growth rates, and the
correlation between annual miles driven and the annual sales growth of our industry should return.
Seven Year Old or Older Vehicles
Since 2008, new vehicle sales have been significantly lower than historical levels, which we believe contributed to
an increasing number of seven year old or older vehicles on the road. We estimate vehicles are driven an average
of approximately 12,500 miles each year. In seven years, the average miles driven equates to approximately
87,500 miles. Our experience is that at this point in a vehicle’s life, most vehicles are not covered by warranties
and increased maintenance is needed to keep the vehicle operating. According to data provided by the
Automotive Aftermarket Industry Association, the number of seven year old or older vehicles increased by
approximately 2.2% during the 2009 calendar year as compared to the 2008 calendar year. As the number of
seven year old or older vehicles on the road increases, we expect an increase in demand for the products that we
sell. In the near term, we expect this trend to continue, as consumers keep their cars longer in an effort to save
money during this uncertain economy.
Results of Operations
Fiscal 2010 Compared with Fiscal 2009
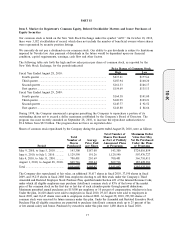
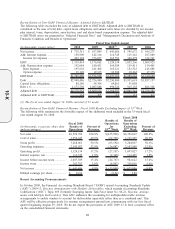
For the fiscal year ended August 28, 2010, we reported net sales of $7.363 billion compared with $6.817 billion
for the year ended August 29, 2009, an 8.0% increase from fiscal 2009. This growth was driven primarily by an
increase in domestic same store sales of 5.4% and sales from new stores of $203.4 million. The improvement in
same store sales was driven by an improvement in transaction count trends, while increases in average transaction
value remained generally consistent with our long-term trends. Higher transaction value is attributable to product
inflation due to both more complex, costly products and commodity price increases.
At August 28, 2010, we operated 4,389 domestic stores and 238 stores in Mexico, compared with 4,229 domestic
stores and 188 stores in Mexico at August 29, 2009. We reported a domestic retail sales increase of 6.9% and a
domestic commercial sales increase of 13.8% for fiscal 2010.
Gross profit for fiscal 2010 was $3.712 billion, or 50.4% of net sales, compared with $3.416 billion, or 50.1% of
net sales for fiscal 2009. The improvement in gross margin was primarily attributable to leveraging distribution
costs due to higher sales and operating efficiencies (19 basis points).
Operating, selling, general and administrative expenses for fiscal 2010 increased to $2.392 billion, or 32.5% of net
sales, from $2.240 billion, or 32.9% of net sales for fiscal 2009. The reduction in operating expenses, as a
percentage of sales, reflected leverage of store operating expenses due to higher sales, partially offset by higher
pension expense (17 basis points) and the continued investment in the hub store initiative (16 basis points).
Interest expense, net for fiscal 2010 was $158.9 million compared with $142.3 million during fiscal 2009. This
increase was due to higher average borrowing levels over the comparable prior year period. Average borrowings
for fiscal 2010 were $2.752 billion, compared with $2.460 billion for fiscal 2009 and weighted average borrowing
rates were 5.3% for fiscal 2010, compared to 5.4% for fiscal 2009.
Our effective income tax rate was 36.4% of pre-tax income for fiscal 2010 compared to 36.4% for fiscal 2009.
Net income for fiscal 2010 increased by 12.4% to $738.3 million, and diluted earnings per share increased 27.6%
to $14.97 from $11.73 in fiscal 2009. The impact of the fiscal 2010 stock repurchases on diluted earnings per
share in fiscal 2010 was an increase of approximately $0.74.
21
10-K