AutoZone 2010 Annual Report Download - page 141
Download and view the complete annual report
Please find page 141 of the 2010 AutoZone annual report below. You can navigate through the pages in the report by either clicking on the pages listed below, or by using the keyword search tool below to find specific information within the annual report.-
 1
1 -
2
-
3
-
4
-
5
-
6
-
7
-
8
-
9
-
10
-
11
-
12
-
13
-
14
-
15
-
16
-
17
-
18
-
19
-
20
-
21
-
22
-
23
-
24
-
25
-
26
-
27
-
28
-
29
-
30
-
31
-
32
-
33
-
34
-
35
-
36
-
37
-
38
-
39
-
40
-
41
-
42
-
43
-
44
-
45
-
46
-
47
-
48
-
49
-
50
-
51
-
52
-
53
-
54
-
55
-
56
-
57
-
58
-
59
-
60
-
61
-
62
-
63
-
64
-
65
-
66
-
67
-
68
-
69
-
70
-
71
-
72
-
73
-
74
-
75
-
76
-
77
-
78
-
79
-
80
-
81
-
82
-
83
-
84
-
85
-
86
-
87
-
88
-
89
-
90
-
91
-
92
-
93
-
94
-
95
-
96
-
97
-
98
-
99
-
100
-
101
-
102
-
103
-
104
-
105
-
106
-
107
-
108
-
109
-
110
-
111
-
112
-
113
-
114
-
115
-
116
-
117
-
118
-
119
-
120
-
121
-
122
-
123
-
124
-
125
-
126
-
127
-
128
-
129
-
130
-
 131
131 -
 132
132 -
 133
133 -
 134
134 -
 135
135 -
 136
136 -
 137
137 -
 138
138 -
 139
139 -
 140
140 -
 141
141 -
 142
142 -
 143
143 -
 144
144 -
 145
145 -
 146
146 -
 147
147 -
 148
148 -
 149
149 -
 150
150 -
 151
151 -
152
-
153
-
154
-
155
-
156
-
157
-
158
-
159
-
160
-
161
-
162
-
163
-
164
-
165
-
166
-
167
-
168
-
169
-
170
-
171
-
172
 |
 |

standard defines fair value as the price received to transfer an asset or paid to transfer a liability in an orderly
transaction between market participants at the measurement date. ASC Topic 820 establishes a framework for
measuring fair value by creating a hierarchy of valuation inputs used to measure fair value, and although it
does not require additional fair value measurements, it applies to other accounting pronouncements that require
or permit fair value measurements.
The hierarchy prioritizes the inputs into three broad levels:
Level 1 inputs — unadjusted quoted prices in active markets for identical assets or liabilities that the
Company has the ability to access. An active market for the asset or liability is one in which transactions
for the asset or liability occur with sufficient frequency and volume to provide ongoing pricing
information.
Level 2 inputs — inputs other than quoted market prices included in Level 1 that are observable, either
directly or indirectly, for the asset or liability. Level 2 inputs include, but are not limited to, quoted prices
for similar assets or liabilities in an active market, quoted prices for identical or similar assets or
liabilities in markets that are not active and inputs other than quoted market prices that are observable for
the asset or liability, such as interest rate curves and yield curves observable at commonly quoted
intervals, volatilities, credit risk and default rates.
Level 3 inputs — unobservable inputs for the asset or liability.
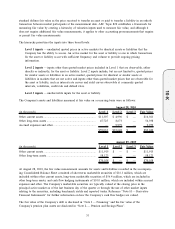
The Company’s assets and liabilities measured at fair value on a recurring basis were as follows:
(in thousands) Level 1 Level 2 Level 3 Fair Value
August 28, 2010
Other current assets....................................................................... $11,307 $ 4,996 $ — $16,303
Other long-term assets .................................................................. 47,725 8,673 — 56,398
Accrued expenses and other ......................................................... — 9,979 — 9,979
$59,032 $23,648 $ — $82,680
(in thousands) Level 1 Level 2 Level 3 Fair Value
August 29, 2009
Other current assets ....................................................................... $11,915 $ — $ — $11,915
Other long-term assets................................................................... 58,123 — — 58,123
$70,038 $ — $ — $70,038
At August 28, 2010, the fair value measurement amounts for assets and liabilities recorded in the accompany-
ing Consolidated Balance Sheet consisted of short-term marketable securities of $16.3 million, which are
included within other current assets, long-term marketable securities of $56.4 million, which are included in
other long-term assets, and cash flow hedging instruments of $10.0 million, which are included within accrued
expenses and other. The Company’s marketable securities are typically valued at the closing price in the
principal active market as of the last business day of the quarter or through the use of other market inputs
relating to the securities, including benchmark yields and reported trades. Reference “Note H — Derivative
Financial Instruments” for further information on how the Company’s cash flow hedges are valued.
The fair value of the Company’s debt is disclosed in “Note I — Financing” and the fair value of the
Company’s pension plan assets are disclosed in “Note L — Pension and Savings Plans”.
51
10-K