AutoZone 2010 Annual Report Download - page 113
Download and view the complete annual report
Please find page 113 of the 2010 AutoZone annual report below. You can navigate through the pages in the report by either clicking on the pages listed below, or by using the keyword search tool below to find specific information within the annual report.-
 1
1 -
2
-
3
-
4
-
5
-
6
-
7
-
8
-
9
-
10
-
11
-
12
-
13
-
14
-
15
-
16
-
17
-
18
-
19
-
20
-
21
-
22
-
23
-
24
-
25
-
26
-
27
-
28
-
29
-
30
-
31
-
32
-
33
-
34
-
35
-
36
-
37
-
38
-
39
-
40
-
41
-
42
-
43
-
44
-
45
-
46
-
47
-
48
-
49
-
50
-
51
-
52
-
53
-
54
-
55
-
56
-
57
-
58
-
59
-
60
-
61
-
62
-
63
-
64
-
65
-
66
-
67
-
68
-
69
-
70
-
71
-
72
-
73
-
74
-
75
-
76
-
77
-
78
-
79
-
80
-
81
-
82
-
83
-
84
-
85
-
86
-
87
-
88
-
89
-
90
-
91
-
92
-
93
-
94
-
95
-
96
-
97
-
98
-
99
-
100
-
101
-
102
-
 103
103 -
 104
104 -
 105
105 -
 106
106 -
 107
107 -
 108
108 -
 109
109 -
 110
110 -
 111
111 -
 112
112 -
 113
113 -
 114
114 -
 115
115 -
 116
116 -
 117
117 -
 118
118 -
 119
119 -
 120
120 -
 121
121 -
 122
122 -
 123
123 -
124
-
125
-
126
-
127
-
128
-
129
-
130
-
131
-
132
-
133
-
134
-
135
-
136
-
137
-
138
-
139
-
140
-
141
-
142
-
143
-
144
-
145
-
146
-
147
-
148
-
149
-
150
-
151
-
152
-
153
-
154
-
155
-
156
-
157
-
158
-
159
-
160
-
161
-
162
-
163
-
164
-
165
-
166
-
167
-
168
-
169
-
170
-
171
-
172
 |
 |

Liquidity and Capital Resources
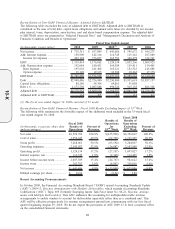
The primary source of our liquidity is our cash flows realized through the sale of automotive parts and
accessories. Net cash provided by operating activities was $1,196.3 million in fiscal 2010, $923.8 million in fiscal
2009, and $921.1 million in fiscal 2008. The increase over prior year was primarily due to higher net income of
$81.3 million and improvements in accounts payable as our cash flows from operating activities continue to
benefit from our inventory purchases being largely financed by our vendors. The increase in fiscal 2009 as
compared to fiscal 2008 was due primarily to the growth in net income, timing of income tax payments and
deductions, and improvements in our accounts payable to inventory ratio as our vendors finance a large portion of
our inventory. Partially offsetting this increase were higher accounts receivable and the 53rd week of income in
fiscal 2008. We had an accounts payable to inventory ratio of 106% at August 28, 2010, 96% at August 29, 2009,
and 95% at August 30, 2008. Our inventory increases are primarily attributable to an increased number of stores
and to a lesser extent, our efforts to update product assortment in all of our stores. Many of our vendors have
supported our initiative to update our product assortment by providing extended payment terms. These extended
payment terms have allowed us to continue to grow accounts payable at a faster rate than inventory.
Our primary capital requirement has been the funding of our continued new-store development program. From the
beginning of fiscal 2008 to August 28, 2010, we have opened 578 new stores. Net cash flows used in investing
activities were $307.4 million in fiscal 2010, compared to $263.7 million in fiscal 2009, and $243.2 million in
fiscal 2008. We invested $315.4 million in capital assets in fiscal 2010, compared to $272.2 million in capital
assets in fiscal 2009, and $243.6 million in capital assets in fiscal 2008. The increase in capital expenditures
during this time was primarily attributable to the number and types of stores opened and increased investment in
our existing stores. New store openings were 213 for fiscal 2010, 180 for fiscal 2009, and 185 for fiscal 2008. We
invest a portion of our assets held by the Company’s wholly owned insurance captive in marketable securities. We
acquired $56.2 million of marketable securities in fiscal 2010, $48.4 million in fiscal 2009, and $54.3 million in
fiscal 2008. We had proceeds from marketable securities of $52.6 million in fiscal 2010, $46.3 million in fiscal
2009, and $50.7 million in fiscal 2008. Capital asset disposals provided $11.5 million in fiscal 2010, $10.7 million
in fiscal 2009, and $4.0 million in fiscal 2008.
Net cash used in financing activities was $883.5 million in fiscal 2010, $806.9 million in fiscal 2009, and $522.7
million in fiscal 2008. The net cash used in financing activities reflected purchases of treasury stock which totaled
$1.1 billion for fiscal 2010, $1.3 billion for fiscal 2009, and $849.2 million for fiscal 2008. The treasury stock
purchases in fiscal 2010, 2009 and 2008 were primarily funded by cash flow from operations, and at times, by
increases in debt levels. Proceeds from issuance of debt were $26.2 million for fiscal 2010, $500.0 million for
fiscal 2009, and $750.0 million for fiscal 2008. There were no debt repayments for fiscal 2010; debt repayments
were $300.7 million for fiscal 2009, and $229.8 million for fiscal 2008. In fiscal 2009, we used the proceeds from
the issuance of debt to repay outstanding commercial paper indebtedness, to prepay our $300 million term loan in
August 2009 and for general corporate purposes, including for working capital requirements, capital expenditures,
store openings and stock repurchases. Proceeds from the debt issuance in fiscal 2008 were used to repay
outstanding commercial paper indebtedness and for general corporate purposes, including for working capital
requirements, capital expenditures, store openings and stock repurchases. Net proceeds from the issuance of
commercial paper were $155.4 million for fiscal 2010 and $277.6 million for fiscal 2009. For fiscal 2008, net
repayments of commercial paper were $206.7 million.
We expect to invest in our business consistent with historical rates during fiscal 2011, with our investment being
directed primarily to our new-store development program and enhancements to existing stores and infrastructure.
The amount of our investments in our new-store program is impacted by different factors, including such factors
as whether the building and land are purchased (requiring higher investment) or leased (generally lower
investment), located in the United States or Mexico, or located in urban or rural areas. During fiscal 2010, fiscal
2009, and fiscal 2008, our capital expenditures have increased by approximately 16%, 12% and 9%, respectively,
as compared to the prior year. Our mix of store openings has moved away from build-to-suit leases (lower cost)
to ground leases and land purchases (higher cost), resulting in increased capital expenditures during the previous
three years, and we expect this trend to continue during the fiscal year ending August 27, 2011.
In addition to the building and land costs, our new-store development program requires working capital,
predominantly for inventories. Historically, we have negotiated extended payment terms from suppliers, reducing
the working capital required and resulting in a high accounts payable to inventory ratio. We plan to continue
leveraging our inventory purchases; however, our ability to do so may be limited by our vendors’ capacity to
23
10-K