AutoZone 2010 Annual Report Download - page 43
Download and view the complete annual report
Please find page 43 of the 2010 AutoZone annual report below. You can navigate through the pages in the report by either clicking on the pages listed below, or by using the keyword search tool below to find specific information within the annual report.-
 1
1 -
2
-
3
-
4
-
5
-
6
-
7
-
8
-
9
-
10
-
11
-
12
-
13
-
14
-
15
-
16
-
17
-
18
-
19
-
20
-
21
-
22
-
23
-
24
-
25
-
26
-
27
-
28
-
29
-
30
-
31
-
32
-
 33
33 -
 34
34 -
 35
35 -
 36
36 -
 37
37 -
 38
38 -
 39
39 -
 40
40 -
 41
41 -
 42
42 -
 43
43 -
 44
44 -
 45
45 -
 46
46 -
 47
47 -
 48
48 -
 49
49 -
 50
50 -
 51
51 -
 52
52 -
 53
53 -
54
-
55
-
56
-
57
-
58
-
59
-
60
-
61
-
62
-
63
-
64
-
65
-
66
-
67
-
68
-
69
-
70
-
71
-
72
-
73
-
74
-
75
-
76
-
77
-
78
-
79
-
80
-
81
-
82
-
83
-
84
-
85
-
86
-
87
-
88
-
89
-
90
-
91
-
92
-
93
-
94
-
95
-
96
-
97
-
98
-
99
-
100
-
101
-
102
-
103
-
104
-
105
-
106
-
107
-
108
-
109
-
110
-
111
-
112
-
113
-
114
-
115
-
116
-
117
-
118
-
119
-
120
-
121
-
122
-
123
-
124
-
125
-
126
-
127
-
128
-
129
-
130
-
131
-
132
-
133
-
134
-
135
-
136
-
137
-
138
-
139
-
140
-
141
-
142
-
143
-
144
-
145
-
146
-
147
-
148
-
149
-
150
-
151
-
152
-
153
-
154
-
155
-
156
-
157
-
158
-
159
-
160
-
161
-
162
-
163
-
164
-
165
-
166
-
167
-
168
-
169
-
170
-
171
-
172
 |
 |

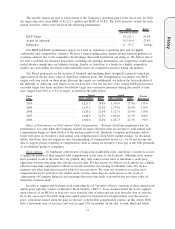
The specific targets are tied to achievement of the Company’s operating plan for the fiscal year. In 2010,
the target objectives were EBIT of $1,221.7 million and ROIC of 24.8%. The 2010 incentive awards for each
named executive officer were based on the following performance:
EBIT ROIC
(Amounts in MMs)
EICP Target .............................................. $1,221.7 24.8%
Actual (as adjusted) ........................................ $1,319.4 27.4%
Difference ............................................... $ 97.7 261bps
Our EBIT and ROIC performance targets are based on AutoZone’s operating plan and are highly
confidential and competitively sensitive. We have a long-standing policy against giving financial guidance to
securities analysts due to the competitive disadvantage that could result from our doing so. We believe that if
we were to publish any financial projections, including any earnings information, our competitors would gain
useful advance insight into our business strategy. Insofar as AutoZone is a leader in a highly competitive
market, any such public disclosure could materially harm our competitive position within our industry.
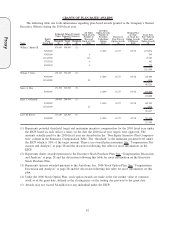
Our Board participates in the creation of financial and operating plans designed to generate long-term
appreciation in the per-share value of AutoZone common stock. The Compensation Committee sets EICP
targets each year based on these plans. Because the targets are confidential, we believe the best indication of
the difficulty of achieving such targets is our track record. Over the last five years, annual EICP payouts have
exceeded target four times and have been below target once (incentive payments during this period of time
have ranged from 94% to 171% of target, as shown in the table below).
Fiscal
Year EBIT ($MMs) ROIC EBIT ($MMs) ROIC
Payout
Percentage
Targets Actual
2010 ........................... 1,221.7 24.8% 1,319.4 27.4% 171%
2009 ........................... 1,137.3 23.5% 1,179.6 24.4% 135%
2008 ........................... 1,120.2 22.6% 1,127.5 23.9% 110%
2007 ........................... 1,048.9 21.5% 1,054.0 22.9% 108%
2006 ........................... 1,040.6 22.4% 1,027.3 22.5% 94%
Effect of Performance on Total Annual Cash Compensation. Because AutoZone emphasizes pay for
performance, it is only when the Company exceeds its target objectives that an executive’s total annual cash
compensation begins to climb relative to the median market level. Similarly, Company performance below
target will cause an executive’s total annual cash compensation to drop below market median. As discussed
below, AutoZone does not engage in strict benchmarking of compensation levels, i.e., we do not use specific
data to support precise targeting of compensation, such as setting an executive’s base pay at the 50th percentile
of an identified group of companies.
Stock options. To emphasize achievement of long-term stockholder value, AutoZone’s executives receive
a significant portion of their targeted total compensation in the form of stock options. Although stock options
have potential worth at the time they are granted, they only confer actual value if AutoZone’s stock price
appreciates between the grant date and the exercise date. For this reason, we believe stock options are a highly
effective long-term compensation vehicle to reward executives for creating stockholder value. We do not
maintain any other long-term incentive plans for our executives. We want our executives to realize total
compensation levels well above the market norm, because when they do, such success is the result of
achievement of Company financial and operating objectives that leads to growth in the per-share value of
AutoZone common stock.
In order to support and facilitate stock ownership by our executive officers, a portion of their annual stock
option grant typically consists of Incentive Stock Options (“ISOs”). If an executive holds the stock acquired
upon exercise of an ISO for at least two years from the date of grant and one year from the date of exercise,
he or she can receive favorable long-term capital gains tax treatment for all appreciation over the exercise
price. (AutoZone cannot claim the gain on exercise as deductible compensation expense in this event). ISOs
have a maximum term of ten years and vest in equal 25% increments on the first, second, third and fourth
33
Proxy