AutoZone 2010 Annual Report Download - page 109
Download and view the complete annual report
Please find page 109 of the 2010 AutoZone annual report below. You can navigate through the pages in the report by either clicking on the pages listed below, or by using the keyword search tool below to find specific information within the annual report.-
 1
1 -
2
-
3
-
4
-
5
-
6
-
7
-
8
-
9
-
10
-
11
-
12
-
13
-
14
-
15
-
16
-
17
-
18
-
19
-
20
-
21
-
22
-
23
-
24
-
25
-
26
-
27
-
28
-
29
-
30
-
31
-
32
-
33
-
34
-
35
-
36
-
37
-
38
-
39
-
40
-
41
-
42
-
43
-
44
-
45
-
46
-
47
-
48
-
49
-
50
-
51
-
52
-
53
-
54
-
55
-
56
-
57
-
58
-
59
-
60
-
61
-
62
-
63
-
64
-
65
-
66
-
67
-
68
-
69
-
70
-
71
-
72
-
73
-
74
-
75
-
76
-
77
-
78
-
79
-
80
-
81
-
82
-
83
-
84
-
85
-
86
-
87
-
88
-
89
-
90
-
91
-
92
-
93
-
94
-
95
-
96
-
97
-
98
-
 99
99 -
 100
100 -
 101
101 -
 102
102 -
 103
103 -
 104
104 -
 105
105 -
 106
106 -
 107
107 -
 108
108 -
 109
109 -
 110
110 -
 111
111 -
 112
112 -
 113
113 -
 114
114 -
 115
115 -
 116
116 -
 117
117 -
 118
118 -
 119
119 -
120
-
121
-
122
-
123
-
124
-
125
-
126
-
127
-
128
-
129
-
130
-
131
-
132
-
133
-
134
-
135
-
136
-
137
-
138
-
139
-
140
-
141
-
142
-
143
-
144
-
145
-
146
-
147
-
148
-
149
-
150
-
151
-
152
-
153
-
154
-
155
-
156
-
157
-
158
-
159
-
160
-
161
-
162
-
163
-
164
-
165
-
166
-
167
-
168
-
169
-
170
-
171
-
172
 |
 |

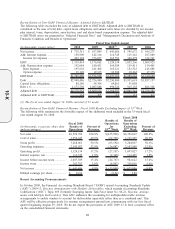
Item 6. Selected Financial Data
(in thousands, except per share data, same store sales and
selected operating data) 2010 2009 2008
(1)
2007 2006
Fiscal Year Ended August
Income Statement Data
Net sales .......................................................................................... $7,362,618 $6,816,824 $6,522,706 $6,169,804 $5,948,355
Cost of sales, including warehouse and delivery expenses ........... 3,650,874 3,400,375 3,254,645 3,105,554 3,009,835
Gross profit...................................................................................... 3,711,744 3,416,449 3,268,061 3,064,250 2,938,520
Operating, selling, general and administrative expenses ............... 2,392,330 2,240,387 2,143,927 2,008,984 1,928,595
Operating profit ............................................................................... 1,319,414 1,176,062 1,124,134 1,055,266 1,009,925
Interest expense, net ........................................................................ 158,909 142,316 116,745 119,116 107,889
Income before income taxes ........................................................... 1,160,505 1,033,746 1,007,389 936,150 902,036
Income tax expense ......................................................................... 422,194 376,697 365,783 340,478 332,761
Net income ...................................................................................... $ 738,311 $ 657,049 $ 641,606 $ 595,672 $ 569,275
Diluted earnings per share .............................................................. $ 14.97 $ 11.73 $ 10.04 $ 8.53 $ 7.50
Adjusted weighted average shares for diluted earnings per
share ............................................................................................. 49,304 55,992 63,875 69,844 75,859
Same Store Sales
Increase in domestic comparable store net sales
(2)
........................ 5.4% 4.4% 0.4% 0.1% 0.4%
Balance Sheet Data
Current assets .................................................................................. $2,611,821 $2,561,730 $2,586,301 $2,270,455 $2,118,927
Working (deficit) capital ................................................................. (452,139) (145,022) 66,981 (15,439) 64,359
Total assets ...................................................................................... 5,571,594 5,318,405 5,257,112 4,804,709 4,526,306
Current liabilities ............................................................................. 3,063,960 2,706,752 2,519,320 2,285,895 2,054,568
Debt ................................................................................................. 2,908,486 2,726,900 2,250,000 1,935,618 1,857,157
Long-term capital leases ................................................................. 66,333 38,029 48,144 39,073 —
Stockholders’ (deficit) equity ......................................................... $ (738,765) $ (433,074) $ 229,687 $ 403,200 $ 469,528
Selected Operating Data
Number of stores at beginning of year ........................................... 4,417 4,240 4,056 3,871 3,673
New stores ................................................................................... 213 180 185 186 204
Closed stores ............................................................................... 3 3 1 1 6
Net new stores ............................................................................. 210 177 184 185 198
Relocated stores........................................................................... 3 9 14 18 18
Number of stores at end of year ..................................................... 4,627 4,417 4,240 4,056 3,871
Total store square footage (in thousands)....................................... 30,027 28,550 27,291 26,044 24,713
Average square footage per store.................................................... 6,490 6,464 6,437 6,421 6,384
Increase in store square footage ..................................................... 5% 5% 5% 5% 6%
Inventory per store (in thousands) .................................................. $ 498 $ 500 $ 507 $ 495 $ 477
Average net sales per store (in thousands) ..................................... $ 1,595 $ 1,541 $ 1,539 $ 1,525 $ 1,546
Net sales per store square foot ....................................................... $ 246 $ 239 $ 239 $ 238 $ 243
Total employees at end of year (in thousands) .............................. 63 60 57 55 53
Merchandise under pay-on-scan arrangements (in thousands) ...... $ 634 $ 3,530 $ 6,732 $ 22,387 $ 92,142
Inventory turnover
(3)
........................................................................ 1.6x 1.5x 1.6x 1.6x 1.7x
Accounts payable to inventory ratio ............................................... 105.6% 96.0% 95.0% 93.2% 92.0%
After-tax return on invested capital
(4)
............................................ 27.6% 24.4% 23.9% 23.2% 22.7%
Adjusted debt to EBITDAR
(5)
........................................................ 2.4 2.5 2.2 2.1 2.1
Net cash provided by operating activities (in thousands) .............. $1,196,252 $ 923,808 $ 921,100 $ 845,194 $ 822,747
Cash flow before share repurchases and changes in debt
(in thousands)
(6)
........................................................................... $ 947,643 $ 673,347 $ 690,621 $ 678,522 $ 599,507
(1) The fiscal year ended August 30, 2008 consisted of 53 weeks.
(2) The domestic comparable sales increases are based on sales for all domestic stores open at least one year.
Relocated stores are included in the same store sales computation based on the year the original store was
opened. Closed store sales are included in the same store sales computation up to the week it closes, and
excluded from the computation for all periods subsequent to closing.
(3) Inventory turnover is calculated as cost of sales divided by the average merchandise inventory balance
over the trailing 5 quarters. The calculation includes cost of sales related to pay-on-scan sales, which were
$2.5 million for the 52 weeks ended August 28, 2010, $5.8 million for the 52 weeks ended August 29,
2009, $19.2 million for the 53 weeks ended August 30, 2008, $85.4 million for the 52 weeks ended
August 25, 2007, and $198.1 million for the 52 weeks ended August 26, 2006.
(4) After-tax return on invested capital is defined as after-tax operating profit (excluding rent charges) divided by
average invested capital (which includes a factor to capitalize operating leases). See Reconciliation of Non-
19
10-K