AutoZone 2010 Annual Report Download - page 118
Download and view the complete annual report
Please find page 118 of the 2010 AutoZone annual report below. You can navigate through the pages in the report by either clicking on the pages listed below, or by using the keyword search tool below to find specific information within the annual report.-
 1
1 -
2
-
3
-
4
-
5
-
6
-
7
-
8
-
9
-
10
-
11
-
12
-
13
-
14
-
15
-
16
-
17
-
18
-
19
-
20
-
21
-
22
-
23
-
24
-
25
-
26
-
27
-
28
-
29
-
30
-
31
-
32
-
33
-
34
-
35
-
36
-
37
-
38
-
39
-
40
-
41
-
42
-
43
-
44
-
45
-
46
-
47
-
48
-
49
-
50
-
51
-
52
-
53
-
54
-
55
-
56
-
57
-
58
-
59
-
60
-
61
-
62
-
63
-
64
-
65
-
66
-
67
-
68
-
69
-
70
-
71
-
72
-
73
-
74
-
75
-
76
-
77
-
78
-
79
-
80
-
81
-
82
-
83
-
84
-
85
-
86
-
87
-
88
-
89
-
90
-
91
-
92
-
93
-
94
-
95
-
96
-
97
-
98
-
99
-
100
-
101
-
102
-
103
-
104
-
105
-
106
-
107
-
 108
108 -
 109
109 -
 110
110 -
 111
111 -
 112
112 -
 113
113 -
 114
114 -
 115
115 -
 116
116 -
 117
117 -
 118
118 -
 119
119 -
 120
120 -
 121
121 -
 122
122 -
 123
123 -
 124
124 -
 125
125 -
 126
126 -
 127
127 -
 128
128 -
129
-
130
-
131
-
132
-
133
-
134
-
135
-
136
-
137
-
138
-
139
-
140
-
141
-
142
-
143
-
144
-
145
-
146
-
147
-
148
-
149
-
150
-
151
-
152
-
153
-
154
-
155
-
156
-
157
-
158
-
159
-
160
-
161
-
162
-
163
-
164
-
165
-
166
-
167
-
168
-
169
-
170
-
171
-
172
 |
 |

10-K
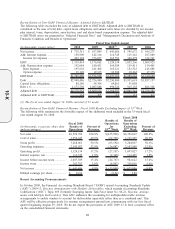
Reconciliation of Non-GAAP Financial Measure: Adjusted Debt to EBITDAR
The following table reconciles the ratio of adjusted debt to EBITDAR. Adjusted debt to EBITDAR is
calculated as the sum of total debt, capital lease obligations and annual rents times six; divided by net income
plus interest, taxes, depreciation, amortization, rent and share-based compensation expense. The adjusted debt
to EBITDAR ratios are presented in “Selected Financial Data” and “Management’s Discussion and Analysis of
Financial Condition and Results of Operations”:
(in thousands, except ratios) 2010 2009 2008
(1)
2007 2006
Fiscal Year Ended August
Net income ............................................. $ 738,311 $ 657,049 $ 641,606 $ 595,672 $ 569,275
Add: Interest expense ............................ 158,909 142,316 116,745 119,116 107,889
Income tax expense ........................... 422,194 376,697 365,783 340,478 332,761
EBIT ....................................................... 1,319,414 1,176,062 1,124,134 1,055,266 1,009,925
Add: Depreciation expense ................... 192,084 180,433 169,509 159,411 139,465
Rent expense ...................................... 195,632 181,308 165,121 152,523 143,888
Option expense .................................. 19,120 19,135 18,388 18,462 17,370
EBITDAR .............................................. $1,726,250 $1,556,938 $1,477,152 $1,385,662 $1,310,648
Debt ........................................................ $2,908,486 $2,726,900 $2,250,000 $1,935,618 $1,857,157
Capital lease obligations........................ 88,280 54,764 64,061 55,088 —
Rent x 6.................................................. 1,173,792 1,087,848 990,726 915,138 863,328
Adjusted debt ......................................... $4,170,558 $3,869,512 $3,304,787 $2,905,844 $2,720,485
Adjusted debt to EDITDAR .................. 2.4 2.5 2.2 2.1 2.1
(1) The fiscal year ended August 30, 2008 consisted of 53 weeks.
Reconciliation of Non-GAAP Financial Measure: Fiscal 2008 Results Excluding Impact of 53
rd
Week
The following table summarizes the favorable impact of the additional week included in the 53-week fiscal
year ended August 30, 2008:
(in thousands, except per share data
and percentages)
Fiscal 2008
Results of
Operations
Percent of
Revenue
Results of
Operations
for
53
rd
Week
Fiscal 2008
Results of
Operations
Excluding
53
rd
Week
Percent of
Revenue
Net sales .............................................. $6,522,706 100.0% $(125,894) $6,396,812 100.0%
Cost of sales ........................................ 3,254,645 49.9% (62,700) 3,191,945 49.9%
Gross profit ......................................... 3,268,061 50.1% (63,194) 3,204,867 50.1%
Operating expenses ............................. 2,143,927 32.9% (36,087) 2,107,840 32.9%
Operating profit .................................. 1,124,134 17.2% (27,107) 1,097,027 17.2%
Interest expense, net ........................... 116,745 1.8% (2,340) 114,405 1.8%
Income before income taxes............... 1,007,389 15.4% (24,767) 982,622 15.4%
Income taxes ....................................... 365,783 5.6% (8,967) 356,816 5.6%
Net income .......................................... $ 641,606 9.8% $ (15,800) $ 625,806 9.8%
Diluted earnings per share .................. $ 10.04 $ (0.24) $ 9.80
Recent Accounting Pronouncements
In October 2009, the Financial Accounting Standards Board (“FASB”) issued Accounting Standards Update
(“ASU”) 2009-13, Revenue Arrangements with Multiple Deliverables, which amends Accounting Standards
Codification (“ASC”) Topic 605 (formerly Emerging Issues Task Force Issue No. 00-21, Revenue Arrange-
ments with Multiple Deliverables). This ASU addresses the accounting for multiple-deliverable revenue
arrangements to enable vendors to account for deliverables separately rather than as a combined unit. This
ASU will be effective prospectively for revenue arrangements entered into commencing with our first fiscal
quarter beginning August 29, 2010. We do not expect the provisions of ASU 2009-13 to have a material effect
on the consolidated financial statements.
28