AutoZone 2010 Annual Report Download - page 129
Download and view the complete annual report
Please find page 129 of the 2010 AutoZone annual report below. You can navigate through the pages in the report by either clicking on the pages listed below, or by using the keyword search tool below to find specific information within the annual report.-
 1
1 -
2
-
3
-
4
-
5
-
6
-
7
-
8
-
9
-
10
-
11
-
12
-
13
-
14
-
15
-
16
-
17
-
18
-
19
-
20
-
21
-
22
-
23
-
24
-
25
-
26
-
27
-
28
-
29
-
30
-
31
-
32
-
33
-
34
-
35
-
36
-
37
-
38
-
39
-
40
-
41
-
42
-
43
-
44
-
45
-
46
-
47
-
48
-
49
-
50
-
51
-
52
-
53
-
54
-
55
-
56
-
57
-
58
-
59
-
60
-
61
-
62
-
63
-
64
-
65
-
66
-
67
-
68
-
69
-
70
-
71
-
72
-
73
-
74
-
75
-
76
-
77
-
78
-
79
-
80
-
81
-
82
-
83
-
84
-
85
-
86
-
87
-
88
-
89
-
90
-
91
-
92
-
93
-
94
-
95
-
96
-
97
-
98
-
99
-
100
-
101
-
102
-
103
-
104
-
105
-
106
-
107
-
108
-
109
-
110
-
111
-
112
-
113
-
114
-
115
-
116
-
117
-
118
-
 119
119 -
 120
120 -
 121
121 -
 122
122 -
 123
123 -
 124
124 -
 125
125 -
 126
126 -
 127
127 -
 128
128 -
 129
129 -
 130
130 -
 131
131 -
 132
132 -
 133
133 -
 134
134 -
 135
135 -
 136
136 -
 137
137 -
 138
138 -
 139
139 -
140
-
141
-
142
-
143
-
144
-
145
-
146
-
147
-
148
-
149
-
150
-
151
-
152
-
153
-
154
-
155
-
156
-
157
-
158
-
159
-
160
-
161
-
162
-
163
-
164
-
165
-
166
-
167
-
168
-
169
-
170
-
171
-
172
 |
 |

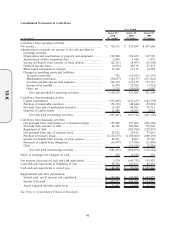
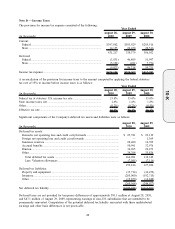
Consolidated Balance Sheets
(in thousands)
August 28,
2010
August 29,
2009
Assets
Current assets:
Cash and cash equivalents ....................................................................................... $ 98,280 $ 92,706
Accounts receivable.................................................................................................. 125,802 126,514
Merchandise inventories........................................................................................... 2,304,579 2,207,497
Other current assets .................................................................................................. 83,160 135,013
Total current assets ............................................................................................... 2,611,821 2,561,730
Property and equipment:
Land .......................................................................................................................... 690,098 656,516
Buildings and improvements.................................................................................... 2,013,301 1,900,610
Equipment ................................................................................................................. 923,595 887,521
Leasehold improvements .......................................................................................... 247,748 219,606
Construction in progress .......................................................................................... 192,519 145,161
4,067,261 3,809,414
Less: Accumulated depreciation and amortization ................................................. 1,547,315 1,455,057
2,519,946 2,354,357
Goodwill ....................................................................................................................... 302,645 302,645
Deferred income taxes ................................................................................................. 46,223 59,067
Other long-term assets ................................................................................................. 90,959 40,606
439,827 402,318
$5,571,594 $ 5,318,405
Liabilities and Stockholders’ Deficit
Current liabilities:
Accounts payable...................................................................................................... $2,433,050 $ 2,118,746
Accrued expenses and other .................................................................................... 432,368 381,271
Income taxes payable ............................................................................................... 25,385 35,145
Deferred income taxes ............................................................................................. 146,971 171,590
Short-term borrowings ............................................................................................. 26,186 —
Total current liabilities ......................................................................................... 3,063,960 2,706,752
Long-term debt ............................................................................................................. 2,882,300 2,726,900
Other long-term liabilities ............................................................................................ 364,099 317,827
Commitments and contingencies ................................................................................. — —
Stockholders’ deficit:
Preferred stock, authorized 1,000 shares; no shares issued .................................... — —
Common stock, par value $.01 per share, authorized 200,000 shares;
50,061 shares issued and 45,107 shares outstanding in 2010 and
57,881 shares issued and 50,801 shares outstanding in 2009 ............................ 501 579
Additional paid-in capital......................................................................................... 557,955 549,326
Retained (deficit) earnings....................................................................................... (245,344) 136,935
Accumulated other comprehensive loss .................................................................. (106,468) (92,035)
Treasury stock, at cost.............................................................................................. (945,409) (1,027,879)
Total stockholders’ deficit .................................................................................... (738,765) (433,074)
$5,571,594 $ 5,318,405
See Notes to Consolidated Financial Statements.
39
10-K