AutoZone 2010 Annual Report Download - page 2
Download and view the complete annual report
Please find page 2 of the 2010 AutoZone annual report below. You can navigate through the pages in the report by either clicking on the pages listed below, or by using the keyword search tool below to find specific information within the annual report.-
 1
1 -
 2
2 -
 3
3 -
 4
4 -
 5
5 -
 6
6 -
 7
7 -
 8
8 -
 9
9 -
 10
10 -
 11
11 -
 12
12 -
 13
13 -
14
-
15
-
16
-
17
-
18
-
19
-
20
-
21
-
22
-
23
-
24
-
25
-
26
-
27
-
28
-
29
-
30
-
31
-
32
-
33
-
34
-
35
-
36
-
37
-
38
-
39
-
40
-
41
-
42
-
43
-
44
-
45
-
46
-
47
-
48
-
49
-
50
-
51
-
52
-
53
-
54
-
55
-
56
-
57
-
58
-
59
-
60
-
61
-
62
-
63
-
64
-
65
-
66
-
67
-
68
-
69
-
70
-
71
-
72
-
73
-
74
-
75
-
76
-
77
-
78
-
79
-
80
-
81
-
82
-
83
-
84
-
85
-
86
-
87
-
88
-
89
-
90
-
91
-
92
-
93
-
94
-
95
-
96
-
97
-
98
-
99
-
100
-
101
-
102
-
103
-
104
-
105
-
106
-
107
-
108
-
109
-
110
-
111
-
112
-
113
-
114
-
115
-
116
-
117
-
118
-
119
-
120
-
121
-
122
-
123
-
124
-
125
-
126
-
127
-
128
-
129
-
130
-
131
-
132
-
133
-
134
-
135
-
136
-
137
-
138
-
139
-
140
-
141
-
142
-
143
-
144
-
145
-
146
-
147
-
148
-
149
-
150
-
151
-
152
-
153
-
154
-
155
-
156
-
157
-
158
-
159
-
160
-
161
-
162
-
163
-
164
-
165
-
166
-
167
-
168
-
169
-
170
-
171
-
172
 |
 |

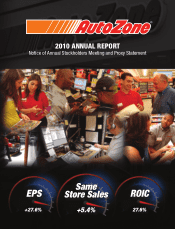
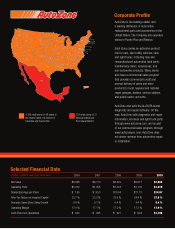
Corporate Profile
(Dollars in millions, except per share data)
Selected Financial Data
Net Sales
Operating Profit
Diluted Earnings per Share
After-Tax Return on Invested Capital
Domestic Same Store Sales Growth
Operating Margin
Cash Flow from Operations
2009
$6,817
$1,176
$11.73
24.4 %
4.4 %
17.3 %
$ 924
2010
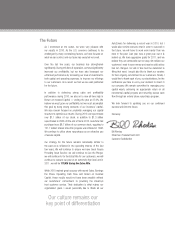
AutoZone is the leading retailer and
a leading distributor of automotive
replacement parts and accessories in the
United States. The Company also operates
stores in Puerto Rico and Mexico.
Each store carries an extensive product
line for cars, sport utility vehicles, vans
and light trucks, including new and
remanufactured automotive hard parts,
maintenance items, accessories, and
non-automotive products. Many stores
also have a commercial sales program
that provides commercial credit and
prompt delivery of parts and other
products to local, regional and national
repair garages, dealers, service stations,
and public sector accounts.
AutoZone also sells the ALLDATA brand
diagnostic and repair software. On the
web, AutoZone sells diagnostic and repair
information, and auto and light truck parts
through www.autozone.com, and as part
of our commercial sales program, through
www.autozonepro.com. AutoZone does
not derive revenue from automotive repair
or installation.
2006
$5,948
$1,010
$ 7.50
22.7 %
0.4 %
17.0 %
$ 823
2007
$6,170
$1,055
$ 8.53
23.2 %
0.1 %
17.1 %
$ 845
2008
$6,523
$1,124
$10.04
23.9 %
0.4 %
17.2 %
$ 921
$7,363
$1,319
$14.97
27.6 %
5.4 %
17.9 %
$1,196
4,389 retail stores in 48 states in
the United States, the District of
Columbia and Puerto Rico
238 retail stores in 31
Mexican states and
the Federal District.
99
120 59
463
66
35 15
70
17
1
68
12
44
217
175
19
214
149
23
38 80
109
6
27
85
100
1
14
50
141
61
123
172
1
229
67
28
114
25
77
2
153
540
39
95
62
6
23
50
5
238
AZO-AnnualReport-2010-18Oct2010.indd 4-5 10/19/10 2:58 PM