AutoZone 2010 Annual Report Download - page 148
Download and view the complete annual report
Please find page 148 of the 2010 AutoZone annual report below. You can navigate through the pages in the report by either clicking on the pages listed below, or by using the keyword search tool below to find specific information within the annual report.-
 1
1 -
2
-
3
-
4
-
5
-
6
-
7
-
8
-
9
-
10
-
11
-
12
-
13
-
14
-
15
-
16
-
17
-
18
-
19
-
20
-
21
-
22
-
23
-
24
-
25
-
26
-
27
-
28
-
29
-
30
-
31
-
32
-
33
-
34
-
35
-
36
-
37
-
38
-
39
-
40
-
41
-
42
-
43
-
44
-
45
-
46
-
47
-
48
-
49
-
50
-
51
-
52
-
53
-
54
-
55
-
56
-
57
-
58
-
59
-
60
-
61
-
62
-
63
-
64
-
65
-
66
-
67
-
68
-
69
-
70
-
71
-
72
-
73
-
74
-
75
-
76
-
77
-
78
-
79
-
80
-
81
-
82
-
83
-
84
-
85
-
86
-
87
-
88
-
89
-
90
-
91
-
92
-
93
-
94
-
95
-
96
-
97
-
98
-
99
-
100
-
101
-
102
-
103
-
104
-
105
-
106
-
107
-
108
-
109
-
110
-
111
-
112
-
113
-
114
-
115
-
116
-
117
-
118
-
119
-
120
-
121
-
122
-
123
-
124
-
125
-
126
-
127
-
128
-
129
-
130
-
131
-
132
-
133
-
134
-
135
-
136
-
137
-
 138
138 -
 139
139 -
 140
140 -
 141
141 -
 142
142 -
 143
143 -
 144
144 -
 145
145 -
 146
146 -
 147
147 -
 148
148 -
 149
149 -
 150
150 -
 151
151 -
 152
152 -
 153
153 -
 154
154 -
 155
155 -
 156
156 -
 157
157 -
 158
158 -
159
-
160
-
161
-
162
-
163
-
164
-
165
-
166
-
167
-
168
-
169
-
170
-
171
-
172
 |
 |

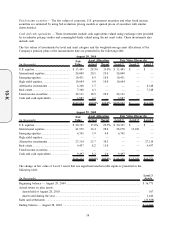
Fixed income securities — The fair values of corporate, U.S. government securities and other fixed income
securities are estimated by using bid evaluation pricing models or quoted prices of securities with similar
characteristics.
Cash and cash equivalents — These investments include cash equivalents valued using exchange rates provided
by an industry pricing vendor and commingled funds valued using the net asset value. These investments also
include cash.
The fair values of investments by level and asset category and the weighted-average asset allocations of the
Company’s pension plans at the measurement date are presented in the following table:
(in thousands)
Fair
Value Actual Target Level 1 Level 2 Level 3
Asset Allocation Fair Value Hierarchy
August 28, 2010
U.S. equities................................................ $ 33,445 28.5% 35.0% $ 33,445 $ — $ —
International equities .................................. 24,049 20.5 25.0 24,049 — —
Emerging equities....................................... 10,431 8.9 10.0 10,431 — —
High yield equities ..................................... 10,604 9.0 10.0 10,604 — —
Alternative investments .............................. 4,348 3.7 — — — 4,348
Real estate .................................................. 7,348 6.3 — — — 7,348
Fixed income securities.............................. 22,131 18.9 20.0 22,131 — —
Cash and cash equivalents ......................... 4,887 4.2 — 4,887 — —
$117,243 100.0% 100.0% $105,547 $ — $11,696
(in thousands)
Fair
Value Actual Target Level 1 Level 2 Level 3
Asset Allocation Fair Value Hierarchy
August 29, 2009
U.S. equities................................................ $ 20,321 17.6% 22.5% $ 20,321 $ — $ —
International equities .................................. 41,959 36.4 28.0 28,678 13,281 —
Emerging equities....................................... 6,765 5.9 6.0 6,765 — —
High yield equities ..................................... — — — — — —
Alternative investments .............................. 27,314 23.7 30.5 — — 27,314
Real estate .................................................. 9,457 8.2 11.0 — — 9,457
Fixed income securities.............................. — — — — — —
Cash and cash equivalents ......................... 9,497 8.2 2.0 9,497 — —
$115,313 100.0% 100.0% $ 65,261 $ 13,281 $36,771
The change in fair value of Level 3 assets that use significant unobservable inputs is presented in the
following table:
(in thousands)
Level 3
Assets
Beginning balance — August 29, 2009 .................................................................................................... $ 36,771
Actual return on plan assets:
Assets held at August 28, 2010 ............................................................................................................ 367
Assets sold during the year ................................................................................................................... 1,446
Sales and settlements ................................................................................................................................ (26,888)
Ending balance — August 28, 2010 ......................................................................................................... $ 11,696
58
10-K