AutoZone 2010 Annual Report Download - page 112
Download and view the complete annual report
Please find page 112 of the 2010 AutoZone annual report below. You can navigate through the pages in the report by either clicking on the pages listed below, or by using the keyword search tool below to find specific information within the annual report.-
 1
1 -
2
-
3
-
4
-
5
-
6
-
7
-
8
-
9
-
10
-
11
-
12
-
13
-
14
-
15
-
16
-
17
-
18
-
19
-
20
-
21
-
22
-
23
-
24
-
25
-
26
-
27
-
28
-
29
-
30
-
31
-
32
-
33
-
34
-
35
-
36
-
37
-
38
-
39
-
40
-
41
-
42
-
43
-
44
-
45
-
46
-
47
-
48
-
49
-
50
-
51
-
52
-
53
-
54
-
55
-
56
-
57
-
58
-
59
-
60
-
61
-
62
-
63
-
64
-
65
-
66
-
67
-
68
-
69
-
70
-
71
-
72
-
73
-
74
-
75
-
76
-
77
-
78
-
79
-
80
-
81
-
82
-
83
-
84
-
85
-
86
-
87
-
88
-
89
-
90
-
91
-
92
-
93
-
94
-
95
-
96
-
97
-
98
-
99
-
100
-
101
-
 102
102 -
 103
103 -
 104
104 -
 105
105 -
 106
106 -
 107
107 -
 108
108 -
 109
109 -
 110
110 -
 111
111 -
 112
112 -
 113
113 -
 114
114 -
 115
115 -
 116
116 -
 117
117 -
 118
118 -
 119
119 -
 120
120 -
 121
121 -
 122
122 -
123
-
124
-
125
-
126
-
127
-
128
-
129
-
130
-
131
-
132
-
133
-
134
-
135
-
136
-
137
-
138
-
139
-
140
-
141
-
142
-
143
-
144
-
145
-
146
-
147
-
148
-
149
-
150
-
151
-
152
-
153
-
154
-
155
-
156
-
157
-
158
-
159
-
160
-
161
-
162
-
163
-
164
-
165
-
166
-
167
-
168
-
169
-
170
-
171
-
172
 |
 |

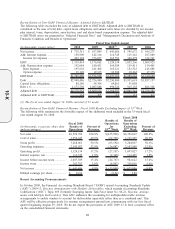
Fiscal 2009 Compared with Fiscal 2008
For the year ended August 29, 2009, we reported net sales of $6.817 billion compared with $6.523 billion for the
year ended August 30, 2008, a 4.5% increase from fiscal 2008. Excluding $125.9 million of sales from the 53rd
week included in the prior year, total company net sales increased 6.6%. This growth was driven primarily by an
increase in domestic same store sales of 4.4% and sales from new stores of $165.5 million. The improvement in
same store sales was driven by an improvement in transaction count trends, while increases in average transaction
value remained generally consistent with our long-term trends. Higher transaction value is attributable to product
inflation due to both more complex, costly products and commodity price increases.
At August 29, 2009, we operated 4,229 domestic stores and 188 stores in Mexico, compared with 4,092 domestic
stores and 148 stores in Mexico at August 30, 2008. Excluding the sales from the 53rd week in the prior year,
domestic retail sales increased 7.1% and domestic commercial sales increased 4.3%.
Gross profit for fiscal 2009 was $3.416 billion, or 50.1% of net sales, compared with $3.268 billion, or 50.1% of
net sales, for fiscal 2008. Gross profit as a percent of net sales was positively impacted by favorable distribution
costs from improved efficiencies and lower fuel costs. However, this favorability was largely offset by a shift in
mix to lower margin products.
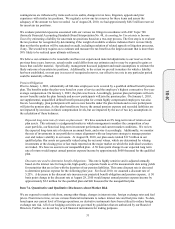
Operating, selling, general and administrative expenses for fiscal 2009 increased to $2.240 billion, or 32.9% of net
sales, from $2.144 billion, or 32.9% of net sales for fiscal 2008. Leverage from increased sales was largely offset
by expenses associated with our continued enhancements to our hub stores (17 basis points), an acceleration of
our store maintenance program (9 basis points), and a continued expansion of our commercial sales force (7 basis
points).
Interest expense, net for fiscal 2009 was $142.3 million compared with $116.7 million during fiscal 2008. This
increase was due to higher average borrowing levels over the comparable prior year period and a higher
percentage of fixed rate debt. Average borrowings for fiscal 2009 were $2.460 billion, compared with $2.024
billion for fiscal 2008 and weighted average borrowing rates were 5.4% for fiscal 2009, compared to 5.2% for
fiscal 2008.
Our effective income tax rate was 36.4% of pre-tax income for fiscal 2009 compared to 36.3% for fiscal 2008.
Net income for fiscal 2009 increased by 2.4% to $657.0 million, and diluted earnings per share increased 16.8% to
$11.73 from $10.04 in fiscal 2008. The impact of the fiscal 2009 stock repurchases on diluted earnings per share
in fiscal 2009 was an increase of approximately $0.78. Excluding the additional week in the prior year, net income
for the year increased 5.0% over the previous year, while diluted earnings per share increased 19.7%.
Seasonality and Quarterly Periods
Our business is somewhat seasonal in nature, with the highest sales typically occurring in the spring and summer
months of February through September, in which average weekly per-store sales historically have been about 15%
to 25% higher than in the slower months of December and January. During short periods of time, a store’s sales
can be affected by weather conditions. Extremely hot or extremely cold weather may enhance sales by causing
parts to fail and spurring sales of seasonal products. Mild or rainy weather tends to soften sales, as parts failure
rates are lower in mild weather, with elective maintenance deferred during periods of rainy weather. Over the
longer term, the effects of weather balance out, as we have stores throughout the United States, Puerto Rico and
Mexico.
Each of the first three quarters of our fiscal year consisted of 12 weeks, and the fourth quarter consisted of 16
weeks in 2010, 16 weeks in 2009, and 17 weeks in 2008. Because the fourth quarter contains the seasonally high
sales volume and consists of 16 or 17 weeks, compared with 12 weeks for each of the first three quarters, our
fourth quarter represents a disproportionate share of the annual net sales and net income. The fourth quarter of
fiscal year 2010, containing 16 weeks, represented 33.2% of annual sales and 36.4% of net income; the fourth
quarter of fiscal 2009, containing 16 weeks, represented 32.7% of annual sales and 35.9% of net income; and the
fourth quarter of fiscal 2008, containing 17 weeks, represented 33.9% of annual sales and 38.0% of net income.
22
10-K