AutoZone 2010 Annual Report Download - page 128
Download and view the complete annual report
Please find page 128 of the 2010 AutoZone annual report below. You can navigate through the pages in the report by either clicking on the pages listed below, or by using the keyword search tool below to find specific information within the annual report.-
 1
1 -
2
-
3
-
4
-
5
-
6
-
7
-
8
-
9
-
10
-
11
-
12
-
13
-
14
-
15
-
16
-
17
-
18
-
19
-
20
-
21
-
22
-
23
-
24
-
25
-
26
-
27
-
28
-
29
-
30
-
31
-
32
-
33
-
34
-
35
-
36
-
37
-
38
-
39
-
40
-
41
-
42
-
43
-
44
-
45
-
46
-
47
-
48
-
49
-
50
-
51
-
52
-
53
-
54
-
55
-
56
-
57
-
58
-
59
-
60
-
61
-
62
-
63
-
64
-
65
-
66
-
67
-
68
-
69
-
70
-
71
-
72
-
73
-
74
-
75
-
76
-
77
-
78
-
79
-
80
-
81
-
82
-
83
-
84
-
85
-
86
-
87
-
88
-
89
-
90
-
91
-
92
-
93
-
94
-
95
-
96
-
97
-
98
-
99
-
100
-
101
-
102
-
103
-
104
-
105
-
106
-
107
-
108
-
109
-
110
-
111
-
112
-
113
-
114
-
115
-
116
-
117
-
 118
118 -
 119
119 -
 120
120 -
 121
121 -
 122
122 -
 123
123 -
 124
124 -
 125
125 -
 126
126 -
 127
127 -
 128
128 -
 129
129 -
 130
130 -
 131
131 -
 132
132 -
 133
133 -
 134
134 -
 135
135 -
 136
136 -
 137
137 -
 138
138 -
139
-
140
-
141
-
142
-
143
-
144
-
145
-
146
-
147
-
148
-
149
-
150
-
151
-
152
-
153
-
154
-
155
-
156
-
157
-
158
-
159
-
160
-
161
-
162
-
163
-
164
-
165
-
166
-
167
-
168
-
169
-
170
-
171
-
172
 |
 |

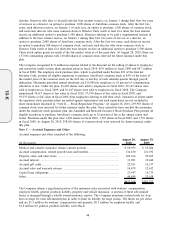
Consolidated Statements of Income
(in thousands, except per share data)
August 28,
2010
(52 weeks)
August 29,
2009
(52 weeks)
August 30,
2008
(53 weeks)
Year Ended
Net sales ................................................................................................. $7,362,618 $6,816,824 $6,522,706
Cost of sales, including warehouse and delivery expenses .................. 3,650,874 3,400,375 3,254,645
Gross profit ............................................................................................ 3,711,744 3,416,449 3,268,061
Operating, selling, general and administrative expenses...................... 2,392,330 2,240,387 2,143,927
Operating profit ..................................................................................... 1,319,414 1,176,062 1,124,134
Interest expense, net .............................................................................. 158,909 142,316 116,745
Income before income taxes.................................................................. 1,160,505 1,033,746 1,007,389
Income tax expense ............................................................................... 422,194 376,697 365,783
Net income ............................................................................................. $ 738,311 $ 657,049 $ 641,606
Weighted average shares for basic earnings per share ......................... 48,488 55,282 63,295
Effect of dilutive stock equivalents....................................................... 816 710 580
Adjusted weighted average shares for diluted earnings per share ....... 49,304 55,992 63,875
Basic earnings per share ........................................................................ $ 15.23 $ 11.89 $ 10.14
Diluted earnings per share..................................................................... $ 14.97 $ 11.73 $ 10.04
See Notes to Consolidated Financial Statements.
38
10-K