AutoZone 2010 Annual Report Download - page 119
Download and view the complete annual report
Please find page 119 of the 2010 AutoZone annual report below. You can navigate through the pages in the report by either clicking on the pages listed below, or by using the keyword search tool below to find specific information within the annual report.-
 1
1 -
2
-
3
-
4
-
5
-
6
-
7
-
8
-
9
-
10
-
11
-
12
-
13
-
14
-
15
-
16
-
17
-
18
-
19
-
20
-
21
-
22
-
23
-
24
-
25
-
26
-
27
-
28
-
29
-
30
-
31
-
32
-
33
-
34
-
35
-
36
-
37
-
38
-
39
-
40
-
41
-
42
-
43
-
44
-
45
-
46
-
47
-
48
-
49
-
50
-
51
-
52
-
53
-
54
-
55
-
56
-
57
-
58
-
59
-
60
-
61
-
62
-
63
-
64
-
65
-
66
-
67
-
68
-
69
-
70
-
71
-
72
-
73
-
74
-
75
-
76
-
77
-
78
-
79
-
80
-
81
-
82
-
83
-
84
-
85
-
86
-
87
-
88
-
89
-
90
-
91
-
92
-
93
-
94
-
95
-
96
-
97
-
98
-
99
-
100
-
101
-
102
-
103
-
104
-
105
-
106
-
107
-
108
-
 109
109 -
 110
110 -
 111
111 -
 112
112 -
 113
113 -
 114
114 -
 115
115 -
 116
116 -
 117
117 -
 118
118 -
 119
119 -
 120
120 -
 121
121 -
 122
122 -
 123
123 -
 124
124 -
 125
125 -
 126
126 -
 127
127 -
 128
128 -
 129
129 -
130
-
131
-
132
-
133
-
134
-
135
-
136
-
137
-
138
-
139
-
140
-
141
-
142
-
143
-
144
-
145
-
146
-
147
-
148
-
149
-
150
-
151
-
152
-
153
-
154
-
155
-
156
-
157
-
158
-
159
-
160
-
161
-
162
-
163
-
164
-
165
-
166
-
167
-
168
-
169
-
170
-
171
-
172
 |
 |

Critical Accounting Policies and Estimates
Preparation of our consolidated financial statements requires us to make estimates and assumptions affecting the
reported amounts of assets and liabilities at the date of the financial statements, reported amounts of revenues and
expenses during the reporting period and related disclosures of contingent liabilities. In the Notes to Consolidated
Financial Statements, we describe our significant accounting policies used in preparing the consolidated financial
statements. Our policies are evaluated on an ongoing basis and are drawn from historical experience and other
assumptions that we believe to be reasonable under the circumstances. Actual results could differ under different
assumptions or conditions. Our senior management has identified the critical accounting policies for the areas that
are materially impacted by estimates and assumptions and have discussed such policies with the Audit Committee
of our Board of Directors. The following items in our consolidated financial statements represent our critical
accounting policies that require significant estimation or judgment by management:
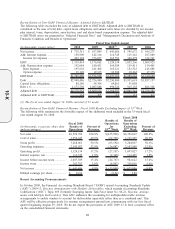
Inventory Reserves and Cost of Sales
LIFO
We state our inventories at the lower of cost or market using the last-in, first-out (“LIFO”) method for domestic
merchandise and the first-in, first out (“FIFO”) method for Mexico inventories. Due to price deflation on our
merchandise purchases, our domestic inventory balances are effectively maintained under the FIFO method. We
do not write up inventory for favorable LIFO adjustments, and due to price deflation, LIFO costs of our domestic
inventories exceed replacement costs by $247.3 million at August 28, 2010, calculated using the dollar value
method.
Inventory Obsolescence and Shrinkage
Our inventory, primarily hard parts, maintenance items, accessories and non-automotive products, is used on
vehicles that have rather long lives; and therefore, the risk of obsolescence is minimal and the majority of excess
inventory has historically been returned to our vendors for credit. In the isolated instances where less than full
credit will be received for such returns and where we anticipate that items will be sold at retail prices that are less
than recorded costs, we record a charge (less than $20 million in each of the last three years) through cost of sales
for the difference. These charges are based on management’s judgment, including estimates and assumptions
regarding marketability of products and the market value of inventory to be sold in future periods.
Historically, we have not encountered material exposure to inventory obsolescence or excess inventory, nor have
we experienced material changes to our estimates. However, we may be exposed to material losses should our
vendors alter their policy with regard to accepting excess inventory returns.
Additionally, we reduce inventory for projected losses related to shrinkage, which is estimated based on historical
losses and current inventory loss trends resulting from previous physical inventories. Shrinkage may occur due to
theft, loss or inaccurate records for the receipt of goods, among other things. Throughout the year, we take
physical inventory counts of our stores and distribution centers to verify these estimates. We make assumptions
regarding upcoming physical inventory counts that may differ from actual results. Over the last three years, there
has been less than a 25 basis point fluctuation in our shrinkage rate.
Each quarter, we evaluate the accrued shrinkage in light of the actual shrink results. To the extent our actual
physical inventory count results differ from our estimates, we may experience material adjustments to our
financial statements. Historically, we have not experienced material adjustments to our shrinkage estimates and
do not believe there is a reasonable likelihood that there will be a material change in the future estimates or
assumptions we use.
A 10% difference in our inventory reserves as of August 28, 2010, would have affected net income by
approximately $5 million in fiscal 2010.
Vendor Allowances
We receive various payments and allowances from our vendors through a variety of programs and arrangements,
including allowances for warranties, advertising and general promotion of vendor products. Vendor allowances
are treated as a reduction of inventory, unless they are provided as a reimbursement of specific, incremental,
identifiable costs incurred by the Company in selling the vendor’s products. Approximately 85% of the vendor
29
10-K