AutoZone 2010 Annual Report Download - page 110
Download and view the complete annual report
Please find page 110 of the 2010 AutoZone annual report below. You can navigate through the pages in the report by either clicking on the pages listed below, or by using the keyword search tool below to find specific information within the annual report.-
 1
1 -
2
-
3
-
4
-
5
-
6
-
7
-
8
-
9
-
10
-
11
-
12
-
13
-
14
-
15
-
16
-
17
-
18
-
19
-
20
-
21
-
22
-
23
-
24
-
25
-
26
-
27
-
28
-
29
-
30
-
31
-
32
-
33
-
34
-
35
-
36
-
37
-
38
-
39
-
40
-
41
-
42
-
43
-
44
-
45
-
46
-
47
-
48
-
49
-
50
-
51
-
52
-
53
-
54
-
55
-
56
-
57
-
58
-
59
-
60
-
61
-
62
-
63
-
64
-
65
-
66
-
67
-
68
-
69
-
70
-
71
-
72
-
73
-
74
-
75
-
76
-
77
-
78
-
79
-
80
-
81
-
82
-
83
-
84
-
85
-
86
-
87
-
88
-
89
-
90
-
91
-
92
-
93
-
94
-
95
-
96
-
97
-
98
-
99
-
 100
100 -
 101
101 -
 102
102 -
 103
103 -
 104
104 -
 105
105 -
 106
106 -
 107
107 -
 108
108 -
 109
109 -
 110
110 -
 111
111 -
 112
112 -
 113
113 -
 114
114 -
 115
115 -
 116
116 -
 117
117 -
 118
118 -
 119
119 -
 120
120 -
121
-
122
-
123
-
124
-
125
-
126
-
127
-
128
-
129
-
130
-
131
-
132
-
133
-
134
-
135
-
136
-
137
-
138
-
139
-
140
-
141
-
142
-
143
-
144
-
145
-
146
-
147
-
148
-
149
-
150
-
151
-
152
-
153
-
154
-
155
-
156
-
157
-
158
-
159
-
160
-
161
-
162
-
163
-
164
-
165
-
166
-
167
-
168
-
169
-
170
-
171
-
172
 |
 |

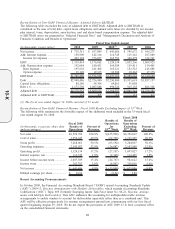
GAAP Financial Measures in Management’s Discussion and Analysis of Financial Condition and Results of
Operations.
(5) Adjusted debt to EBITDAR is defined as the sum of total debt, capital lease obligations and annual rents times
six; divided by net income plus interest, taxes, depreciation, amortization, rent and share-based compensation
expense. See Reconciliation of Non-GAAP Financial Measures in Management’s Discussion and Analysis of
Financial Condition and Results of Operations.
(6) Cash flow before share repurchases and changes in debt is defined as the change in cash and cash equivalents
less the change in debt plus treasury stock purchases. See Reconciliation of Non-GAAP Financial Measures
in Management’s Discussion and Analysis of Financial Condition and Results of Operations.
Item 7. Management’s Discussion and Analysis of Financial Condition and Results of Operations
We are the nation’s leading retailer and a leading distributor of automotive replacement parts and accessories. We
began operations in 1979 and at August 28, 2010, operated 4,389 stores in the United States and Puerto Rico, and
238 in Mexico. Each of our stores carries an extensive product line for cars, sport utility vehicles, vans and light
trucks, including new and remanufactured automotive hard parts, maintenance items, accessories and non-
automotive products. At August 28, 2010, in 2,424 of our domestic stores and 173 of our Mexico stores, we also
have a commercial sales program that provides prompt delivery of parts and other products to local, regional and
national repair garages, dealers, service stations and public sector accounts. We also sell the ALLDATA brand
automotive diagnostic and repair software through www.alldata.com. Additionally, we sell automotive hard parts,
maintenance items, accessories and non-automotive products through www.autozone.com, and as part of our
commercial sales program, through www.autozonepro.com. We do not derive revenue from automotive repair or
installation services.
Executive Summary
We achieved a strong performance in fiscal 2010, delivering record earnings of $738 million and sales growth of
$546 million over the prior year. We completed the year with strong growth in our commercial and retail
businesses. We are excited about our retail business opportunities and encouraged by the increase in our
commercial business, where we continue to build our internal sales force and to refine our parts assortment. There
are various factors occurring within the current economy that affect both our customers and our industry,
including the impact of the recent recession, the credit crisis and higher unemployment. As consumers’ cash flows
have decreased due to these factors, we believe consumers have become more likely to keep their current vehicles
longer and perform repair and maintenance in order to keep those vehicles well maintained. Our belief is
supported by industry data showing an increase in the average age of vehicles on the road and recent declines in
new car sales, which we believe have led to an increase in demand for the products that we sell. Given the nature
of these macroeconomic factors, we cannot predict whether or for how long these trends will continue, nor can we
predict to what degree these trends will impact us in the future. Our primary response to fluctuations in the
demand for the products we sell is to adjust our advertising message, store staffing, and product assortment. We
continue to believe we are well positioned to help our customers save money and meet their needs in a
challenging macro economic environment.
Also, we believe changes in gas prices impact our customers’ behavior with respect to driving and maintaining
their cars. With approximately ten billion gallons of unleaded gas consumed each month across the United States,
each $1 dollar decrease at the pump contributes approximately $10 billion of additional spending capacity to
consumers each month. Given the unpredictability of gas prices, we cannot predict whether gas prices will
increase or decrease in the future, nor can we predict how any future changes in gas prices will impact our sales in
future periods.
The two statistics we believe have the closest correlation to our market growth over the long-term are miles driven
and the number of seven year old or older vehicles on the road.
20
10-K