AutoZone 2010 Annual Report Download - page 130
Download and view the complete annual report
Please find page 130 of the 2010 AutoZone annual report below. You can navigate through the pages in the report by either clicking on the pages listed below, or by using the keyword search tool below to find specific information within the annual report.-
 1
1 -
2
-
3
-
4
-
5
-
6
-
7
-
8
-
9
-
10
-
11
-
12
-
13
-
14
-
15
-
16
-
17
-
18
-
19
-
20
-
21
-
22
-
23
-
24
-
25
-
26
-
27
-
28
-
29
-
30
-
31
-
32
-
33
-
34
-
35
-
36
-
37
-
38
-
39
-
40
-
41
-
42
-
43
-
44
-
45
-
46
-
47
-
48
-
49
-
50
-
51
-
52
-
53
-
54
-
55
-
56
-
57
-
58
-
59
-
60
-
61
-
62
-
63
-
64
-
65
-
66
-
67
-
68
-
69
-
70
-
71
-
72
-
73
-
74
-
75
-
76
-
77
-
78
-
79
-
80
-
81
-
82
-
83
-
84
-
85
-
86
-
87
-
88
-
89
-
90
-
91
-
92
-
93
-
94
-
95
-
96
-
97
-
98
-
99
-
100
-
101
-
102
-
103
-
104
-
105
-
106
-
107
-
108
-
109
-
110
-
111
-
112
-
113
-
114
-
115
-
116
-
117
-
118
-
119
-
 120
120 -
 121
121 -
 122
122 -
 123
123 -
 124
124 -
 125
125 -
 126
126 -
 127
127 -
 128
128 -
 129
129 -
 130
130 -
 131
131 -
 132
132 -
 133
133 -
 134
134 -
 135
135 -
 136
136 -
 137
137 -
 138
138 -
 139
139 -
 140
140 -
141
-
142
-
143
-
144
-
145
-
146
-
147
-
148
-
149
-
150
-
151
-
152
-
153
-
154
-
155
-
156
-
157
-
158
-
159
-
160
-
161
-
162
-
163
-
164
-
165
-
166
-
167
-
168
-
169
-
170
-
171
-
172
 |
 |

10-K
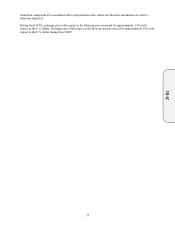
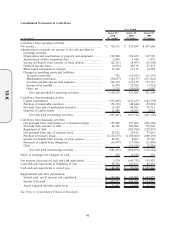
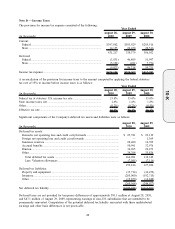
Consolidated Statements of Cash Flows
(in thousands)
August 28,
2010
(52 weeks)
August 29,
2008
(52 weeks)
August 30,
2009
(53 weeks)
Year Ended
Cash flows from operating activities:
Net income ............................................................................................ $ 738,311 $ 657,049 $ 641,606
Adjustments to reconcile net income to net cash provided by
operating activities:
Depreciation and amortization of property and equipment ............ 192,084 180,433 169,509
Amortization of debt origination fees .............................................. 6,495 3,644 1,837
Income tax benefit from exercise of stock options ......................... (22,251) (8,407) (10,142)
Deferred income taxes ...................................................................... (9,023) 46,318 67,474
Share-based compensation expense ................................................. 19,120 19,135 18,388
Changes in operating assets and liabilities:
Accounts receivable ...................................................................... 782 (56,823) (11,145)
Merchandise inventories ............................................................... (96,077) (76,337) (137,841)
Accounts payable and accrued expenses ..................................... 349,122 137,158 175,733
Income taxes payable.................................................................... 12,474 32,264 (3,861)
Other, net ...................................................................................... 5,215 (10,626) 9,542
Net cash provided by operating activities ................................ 1,196,252 923,808 921,100
Cash flows from investing activities:
Capital expenditures ......................................................................... (315,400) (272,247) (243,594)
Purchase of marketable securities .................................................... (56,156) (48,444) (54,282)
Proceeds from sale of marketable securities ................................... 52,620 46,306 50,712
Disposal of capital assets ................................................................. 11,489 10,663 4,014
Net cash used in investing activities ........................................ (307,447) (263,722) (243,150)
Cash flows from financing activities:
Net proceeds from (repayments of ) commercial paper.................. 155,400 277,600 (206,700)
Proceeds from issuance of debt ....................................................... 26,186 500,000 750,000
Repayment of debt ............................................................................ — (300,700) (229,827)
Net proceeds from sale of common stock ....................................... 52,922 39,855 27,065
Purchase of treasury stock................................................................ (1,123,655) (1,300,002) (849,196)
Income tax benefit from exercise of stock options ......................... 22,251 8,407 10,142
Payments of capital lease obligations .............................................. (16,597) (17,040) (15,880)
Other.................................................................................................. — (15,016) (8,286)
Net cash used in financing activities ....................................... (883,493) (806,896) (522,682)
Effect of exchange rate changes on cash............................................. 262 (2,945) 539
Net increase (decrease) in cash and cash equivalents ......................... 5,574 (149,755) 155,807
Cash and cash equivalents at beginning of year.................................. 92,706 242,461 86,654
Cash and cash equivalents at end of year ............................................ $ 98,280 $ 92,706 $ 242,461
Supplemental cash flow information:
Interest paid, net of interest cost capitalized ................................... $ 150,745 $ 132,905 $ 107,477
Income taxes paid ............................................................................. $ 420,575 $ 299,021 $ 313,875
Assets acquired through capital lease .............................................. $ 75,881 $ 16,880 $ 61,572
See Notes to Consolidated Financial Statements.
40