Aflac 2007 Annual Report Download - page 67
Download and view the complete annual report
Please find page 67 of the 2007 Aflac annual report below. You can navigate through the pages in the report by either clicking on the pages listed below, or by using the keyword search tool below to find specific information within the annual report.-
 1
1 -
2
-
3
-
4
-
5
-
6
-
7
-
8
-
9
-
10
-
11
-
12
-
13
-
14
-
15
-
16
-
17
-
18
-
19
-
20
-
21
-
22
-
23
-
24
-
25
-
26
-
27
-
28
-
29
-
30
-
31
-
32
-
33
-
34
-
35
-
36
-
37
-
38
-
39
-
40
-
41
-
42
-
43
-
44
-
45
-
46
-
47
-
48
-
49
-
50
-
51
-
52
-
53
-
54
-
55
-
56
-
 57
57 -
 58
58 -
 59
59 -
 60
60 -
 61
61 -
 62
62 -
 63
63 -
 64
64 -
 65
65 -
 66
66 -
 67
67 -
 68
68 -
 69
69 -
 70
70 -
 71
71 -
 72
72 -
 73
73 -
 74
74 -
 75
75 -
 76
76 -
 77
77 -
78
-
79
-
80
-
81
-
82
 |
 |

63
Annual Report for 2007
We have also designated our yen-denominated Samurai and
Uridashi notes (see Note 7) as hedges of the foreign currency
exposure of our investment in Aflac Japan.
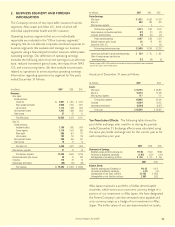
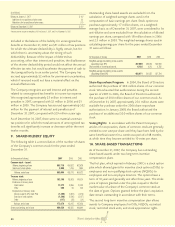
5. DEFERRED POLICY ACQUISITION COSTS AND
INSURANCE EXPENSES
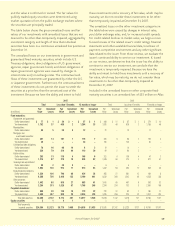
Consolidated policy acquisition costs deferred were $1.09
billion in 2007, compared with $1.05 billion in 2006 and $1.00
billion in 2005. The following table presents a rollforward of
deferred policy acquisition costs by segment for the years
ended December 31.
2007 2006
(In millions) Japan U.S. Japan U.S.
Deferred policy acquisition costs:
Balance, beginning of year $ 3,857 $ 2,168 $ 3,624 $ 1,966
Capitalization 555 539 556 492
Amortization (318) (322) (284) (290)
Foreign currency translation and other 175 – (39) –
Balance, end of year $ 4,269 $ 2,385 $ 3,857 $ 2,168
Commissions deferred as a percentage of total acquisition costs
deferred were 74% in 2007 and 76% in both 2006 and 2005.
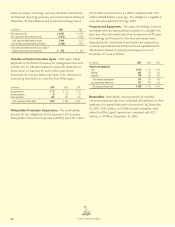
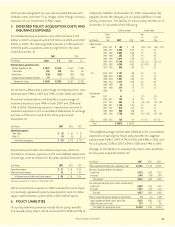
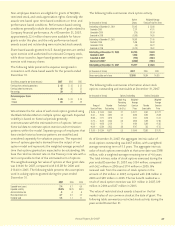
Personnel, compensation and benefits as a percentage of
insurance expenses were 44% in both 2007 and 2006 and
41% in 2005. Advertising expense is reported as incurred in
insurance expenses in the consolidated statements of earnings
and was as follows for each of the three years ended
December 31:
(In millions) 2007 2006 2005
Advertising expense:
Aflac Japan $83 $82 $87
Aflac U.S. 95 88 87
Total advertising expense $ 178 $ 170 $ 174
Depreciation and other amortization expenses, which are
included in insurance expenses in the consolidated statements
of earnings, were as follows for the years ended December 31:
(In millions) 2007 2006 2005
Depreciation expense $51 $44 $44
Other amortization expense 14 15 60
Total depreciation and other amortization expense* $65 $ 59 $104
*Aflac Japan accounted for $37 in 2007, $33 in 2006 and $77 in 2005.
Other amortization expense in 2005 included the write-down
of previously capitalized systems development costs for Aflac
Japan’s administration system ($46 million before taxes).
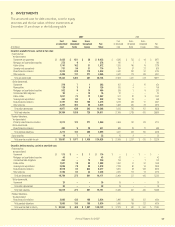
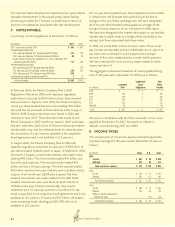
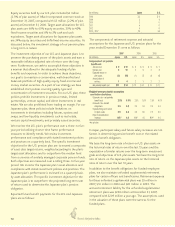
6. POLICY LIABILITIES
Our policy liabilities primarily include future policy benefits
and unpaid policy claims, which accounted for 90% and 5% of
total policy liabilities at December 31, 2007, respectively. We
regularly review the adequacy of our policy liabilities in total
and by component. The liability for future policy benefits as of
December 31 consisted of the following:
Liability Amounts Interest Rates
Policy Year
Issue of In 20
(In millions) Year 2007 2006 Issue Years
Health insurance:
Japan: 2005 - 2007 $ 284 $ 148 1.85% - 2.5% 1.85% - 2.5%
1999 - 2007 6,345 5,010 3.0 3.0
1997 - 1999 2,650 2,426 3.5 3.5
1995 - 1996 283 259 4.0 4.0
1994 - 1996 3,810 3,493 4.5 4.5
1987 - 1994 17,100 15,911 5.25 - 5.5 5.25 - 5.5
1978 - 1986 4,208 4,007 6.5 - 6.75 5.5
1974 - 1979 859 853 7.0 5.0
U.S.: 2005 - 2007 1,107 648 5.5 5.5
1998 - 2004 1,023 961 7.0 7.0
1988 - 2004 1,057 1,026 8.0 6.0
1986 - 2004 1,377 1,379 6.0 6.0
1985 - 1986 25 26 6.5 6.5
1981 - 1986 210 217 7.0 5.5
Other 31 33
Life insurance:
Japan: 2007 41 – 2.75 2.75
2006 - 2007 130 24 2.5 2.5
2001 - 2007 485 98 1.65 - 1.85 1.65 - 1.85
1999 - 2007 1,155 1,104 3.0 3.0
1997 - 2007 619 572 3.5 3.5
1994 - 1996 948 886 4.0 4.0
1985 - 1993 1,798 1,656 5.25 - 5.65 5.25 - 5.65
U.S.: 1956 - 2006 130 104 4.0 - 6.0 4.0 - 6.0
Total $ 45,675 $ 40,841
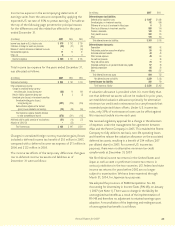
The weighted-average interest rates reflected in the consolidated
statements of earnings for future policy benefits for Japanese
policies were 4.6% in 2007, 4.7% in 2006 and 4.8% in 2005; and
for U.S. policies, 6.2% in 2007, 6.3% in 2006 and 6.4% in 2005.
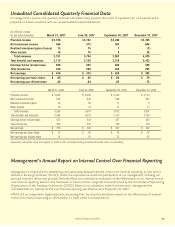
Changes in the liability for unpaid policy claims were as follows
for the years ended December 31:
(In millions) 2007 2006 2005
Unpaid supplemental health claims, beginning of year $ 2,293 $ 2,375 $ 2,230
Add claims incurred during the year related to:
Current year 5,225 5,045 5,203
Prior years (401) (516) (401)
Total incurred 4,824 4,529 4,802
Less claims paid during the year on claims incurred during:
Current year 3,600 3,435 3,352
Prior years 1,257 1,162 1,106
Total paid 4,857 4,597 4,458
Effect of foreign exchange rate changes on unpaid claims 72 (14) (199)
Unpaid supplemental health claims, end of year 2,332 2,293 2,375
Unpaid life claims, end of year 123 97 129
Total liability for unpaid policy claims $ 2,455 $ 2,390 $ 2,504