Aflac 2007 Annual Report Download - page 5
Download and view the complete annual report
Please find page 5 of the 2007 Aflac annual report below. You can navigate through the pages in the report by either clicking on the pages listed below, or by using the keyword search tool below to find specific information within the annual report.-
 1
1 -
 2
2 -
 3
3 -
 4
4 -
 5
5 -
 6
6 -
 7
7 -
 8
8 -
 9
9 -
 10
10 -
 11
11 -
 12
12 -
 13
13 -
 14
14 -
 15
15 -
 16
16 -
17
-
18
-
19
-
20
-
21
-
22
-
23
-
24
-
25
-
26
-
27
-
28
-
29
-
30
-
31
-
32
-
33
-
34
-
35
-
36
-
37
-
38
-
39
-
40
-
41
-
42
-
43
-
44
-
45
-
46
-
47
-
48
-
49
-
50
-
51
-
52
-
53
-
54
-
55
-
56
-
57
-
58
-
59
-
60
-
61
-
62
-
63
-
64
-
65
-
66
-
67
-
68
-
69
-
70
-
71
-
72
-
73
-
74
-
75
-
76
-
77
-
78
-
79
-
80
-
81
-
82
 |
 |

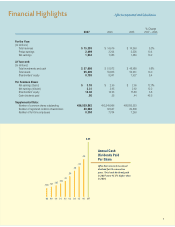
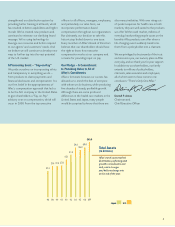
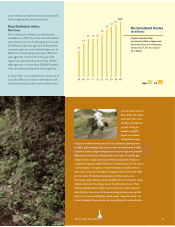
98 99 00 01 02 03 04 05 06 07
.128 .14 7 .167 .193
.23
.30
.38
.44
.55
$.80
Aflac Incorporated and Subsidiaries
% Change
2007 2006 2005 2007 – 2006
For the Year:
(In millions)
Total revenues $ 15,393 $ 14,616 $ 14,363 5.3%
Pretax earnings 2,499 2,264 2,226 10.4
Net earnings 1,634 1,483 1,483 10.2
At Year-end:
(In millions)
Total investments and cash $ 57,056 $ 51,972 $ 48,989 9.8%
Total assets 65,805 59,805 56,361 10.0
Shareholders’ equity 8,795 8,341 7,927 5.4
Per Common Share:
Net earnings (basic) $ 3.35 $ 2.99 $ 2.96 12.0%
Net earnings (diluted) 3.31 2.95 2.92 12.2
Shareholders’ equity 18.08 16.93 15.89 6.8
Cash dividends paid .80 .55 .44 45.5
Supplemental Data:
Number of common shares outstanding 486,529,962 492,549,966 498,893,553
Number of registered common shareholders 80,062 82,647 80,808
Number of full-time employees 8,358 7,704 7,263
Financial Highlights
1
Annual Cash
Dividends Paid
Per Share
Aflac has increased its annual
dividend for 25 consecutive
years. Total cash dividends paid
in 2007 were 45.5% higher than
in 2006.