Aflac 2007 Annual Report Download - page 50
Download and view the complete annual report
Please find page 50 of the 2007 Aflac annual report below. You can navigate through the pages in the report by either clicking on the pages listed below, or by using the keyword search tool below to find specific information within the annual report.-
 1
1 -
2
-
3
-
4
-
5
-
6
-
7
-
8
-
9
-
10
-
11
-
12
-
13
-
14
-
15
-
16
-
17
-
18
-
19
-
20
-
21
-
22
-
23
-
24
-
25
-
26
-
27
-
28
-
29
-
30
-
31
-
32
-
33
-
34
-
35
-
36
-
37
-
38
-
39
-
 40
40 -
 41
41 -
 42
42 -
 43
43 -
 44
44 -
 45
45 -
 46
46 -
 47
47 -
 48
48 -
 49
49 -
 50
50 -
 51
51 -
 52
52 -
 53
53 -
 54
54 -
 55
55 -
 56
56 -
 57
57 -
 58
58 -
 59
59 -
 60
60 -
61
-
62
-
63
-
64
-
65
-
66
-
67
-
68
-
69
-
70
-
71
-
72
-
73
-
74
-
75
-
76
-
77
-
78
-
79
-
80
-
81
-
82
 |
 |

46 There’s Only One Aflac
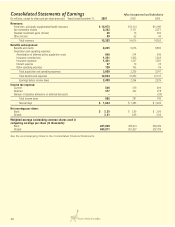
Consolidated Statements of Earnings Aflac Incorporated and Subsidiaries
(In millions, except for share and per-share amounts) Years Ended December 31, 2007 2006 2005
Revenues:
Premiums, principally supplemental health insurance $ 12,973 $12,314 $11,990
Net investment income 2,333 2,171 2,071
Realized investment gains (losses) 28 79 262
Other income 59 52 40
Total revenues 15,393 14,616 14,363
Benefits and expenses:
Benefits and claims 9,285 9,016 8,890
Acquisition and operating expenses:
Amortization of deferred policy acquisition costs 640 574 542
Insurance commissions 1,331 1,303 1,302
Insurance expenses 1,491 1,337 1,281
Interest expense 27 19 23
Other operating expenses 120 103 99
Total acquisition and operating expenses 3,609 3,336 3,247
Total benefits and expenses 12,894 12,352 12,137
Earnings before income taxes 2,499 2,264 2,226
Income tax expense:
Current 548 419 499
Deferred 317 362 278
Release of valuation allowance on deferred tax assets –– (34)
Total income taxes 865 781 743
Net earnings $ 1,634 $ 1,483 $ 1,483
Net earnings per share:
Basic $ 3.35 $ 2.99 $ 2.96
Diluted 3.31 2.95 2.92
Weighted-average outstanding common shares used in
computing earnings per share (In thousands):
Basic 487,869 495,614 500,939
Diluted 493,971 501,827 507,704
See the accompanying Notes to the Consolidated Financial Statements.