Aflac 2007 Annual Report Download - page 32
Download and view the complete annual report
Please find page 32 of the 2007 Aflac annual report below. You can navigate through the pages in the report by either clicking on the pages listed below, or by using the keyword search tool below to find specific information within the annual report.-
 1
1 -
2
-
3
-
4
-
5
-
6
-
7
-
8
-
9
-
10
-
11
-
12
-
13
-
14
-
15
-
16
-
17
-
18
-
19
-
20
-
21
-
 22
22 -
 23
23 -
 24
24 -
 25
25 -
 26
26 -
 27
27 -
 28
28 -
 29
29 -
 30
30 -
 31
31 -
 32
32 -
 33
33 -
 34
34 -
 35
35 -
 36
36 -
 37
37 -
 38
38 -
 39
39 -
 40
40 -
 41
41 -
 42
42 -
43
-
44
-
45
-
46
-
47
-
48
-
49
-
50
-
51
-
52
-
53
-
54
-
55
-
56
-
57
-
58
-
59
-
60
-
61
-
62
-
63
-
64
-
65
-
66
-
67
-
68
-
69
-
70
-
71
-
72
-
73
-
74
-
75
-
76
-
77
-
78
-
79
-
80
-
81
-
82
 |
 |

28 There’s Only One Aflac
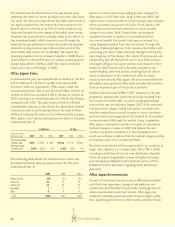
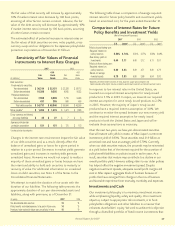
31, 2007, to changes in severity and frequency of claims. For
the years 2005 through 2007, and before the effect of the
fourth quarter 2006 adjustments noted above, our
assumptions changed on average by approximately 1% in
total, and we believe that a variation in assumptions in a range
of plus or minus 1% in total is reasonably likely to occur.
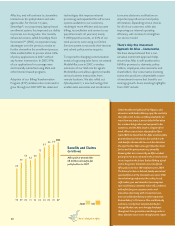
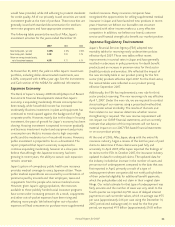
The growth of the future policy benefits liability is the result
of the aging of our in-force block of business and the addition
of new business. In addition, the growth in 2006 was
moderately impacted by the previously discussed transfer of
$170 million at Aflac U.S. and $85 million at Aflac Japan from
the unpaid policy claims liability to the future policy benefits
liability. These two transfers accounted for less than 1% of the
increase in the aggregate. The table below reflects the growth
of future policy benefits liability for the years ended
December 31.
New Accounting Pronouncements
During the last three years, various accounting standard-
setting bodies have been active in soliciting comments and
issuing statements, interpretations and exposure drafts. For
information on new accounting pronouncements and the
impact, if any, on our financial position or results of
operations, see Note 1 of the Notes to the Consolidated
Financial Statements.
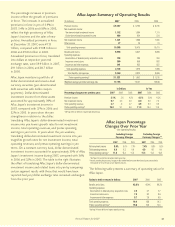
RESULTS OF OPERATIONS
The following table is a presentation of items impacting net
earnings and net earnings per diluted share for the years
ended December 31.
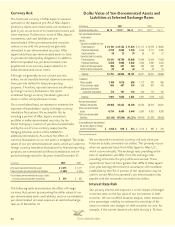
Realized Investment Gains and Losses
Our investment strategy is to invest in investment-grade fixed-
income securities to provide a reliable stream of investment
income, which is one of the drivers of the Company’s
profitability. We do not purchase securities with the intent of
generating capital gains or losses. However, investment gains
and losses may be realized as a result of changes in the
financial markets and the creditworthiness of specific issuers,
tax planning strategies, and/or general portfolio maintenance
and rebalancing. The realization of investment gains and losses
is independent of the underwriting and administration of our
insurance products, which are the principal drivers of our
profitability.
In 2007, we realized pretax gains of $28 million (after-tax, $19
million, or $.04 per diluted share) primarily as a result of
securities sold or redeemed in the normal course of business.
In 2006, we realized pretax gains of $79 million (after-tax, $51
million, or $.10 per diluted share) primarily as a result of bond
swaps and the liquidation of equity securities held by Aflac
U.S. In 2005, we realized pretax gains of $262 million (after-
tax, $167 million, or $.33 per diluted share) primarily as a
result of bond swaps. We began our bond-swap program in
the second half of 2005 and concluded it in the first half of
2006. These bond swaps took advantage of tax loss
carryforwards and also resulted in an improvement in overall
portfolio credit quality and investment income.
Impact from SFAS 133
We entered into cross-currency swap agreements to
effectively convert our dollar-denominated senior notes,
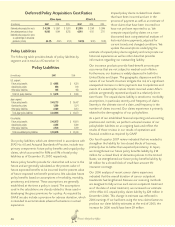
Sensitivity of Unpaid Policy
Claims Liability
Total Severity
Decrease Decrease Increase Increase
(In millions) by 2% by 1% Unchanged by 1% by 2%
Total Frequency
Increase by 2% $ – $ 16 $ 32 $ 49 $ 66
Increase by 1% (16) – 16 33 49
Unchanged (32) (16) – 16 32
Decrease by 1% (48) (32) (16) – 16
Decrease by 2% (63) (48) (32) (16) –
Future Policy Benefits
(In millions of dollars and billions of yen) 2007 2006
2005
Aflac U.S. $ 4,958 $ 4,391 $ 3,780
Growth rate 12.9% 16.2% 12.7%
Aflac Japan $ 40,715 $ 36,447 $ 34,071
Growth rate 11.7% 7.0% (5.4)%
Consolidated $ 45,675 $ 40,841 $ 37,853
Growth rate 11.8% 7.9% (3.8)%
Yen/dollar exchange rate (end of period) 114.15 119.11 118.07
Aflac Japan ¥ 4,648 ¥ 4,341 ¥ 4,023
Growth rate 7.1% 7.9% 7.2%
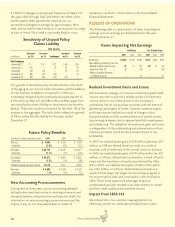
Items Impacting Net Earnings
In Millions Per Diluted Share
2007 2006 2005 2007 2006 2005
Net earnings $1,634 $1,483 $1,483 $3.31 $2.95 $2.92
Items impacting net earnings, net of tax:
Realized investment gains (losses) 19 51 167 .04 .10 .33
Impact from SFAS 133 2– (10) –– (.02)
Release of valuation allowance
on deferred tax assets ––34 ––.07