Aflac 2007 Annual Report Download - page 63
Download and view the complete annual report
Please find page 63 of the 2007 Aflac annual report below. You can navigate through the pages in the report by either clicking on the pages listed below, or by using the keyword search tool below to find specific information within the annual report.-
 1
1 -
2
-
3
-
4
-
5
-
6
-
7
-
8
-
9
-
10
-
11
-
12
-
13
-
14
-
15
-
16
-
17
-
18
-
19
-
20
-
21
-
22
-
23
-
24
-
25
-
26
-
27
-
28
-
29
-
30
-
31
-
32
-
33
-
34
-
35
-
36
-
37
-
38
-
39
-
40
-
41
-
42
-
43
-
44
-
45
-
46
-
47
-
48
-
49
-
50
-
51
-
52
-
 53
53 -
 54
54 -
 55
55 -
 56
56 -
 57
57 -
 58
58 -
 59
59 -
 60
60 -
 61
61 -
 62
62 -
 63
63 -
 64
64 -
 65
65 -
 66
66 -
 67
67 -
 68
68 -
 69
69 -
 70
70 -
 71
71 -
 72
72 -
 73
73 -
74
-
75
-
76
-
77
-
78
-
79
-
80
-
81
-
82
 |
 |

59
Annual Report for 2007
and the value is confirmed or revised. The fair values for
publicly traded equity securities were determined using
market quotations from the public exchange markets where
the securities are principally traded.
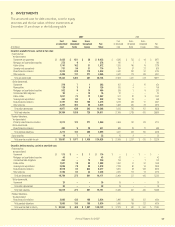
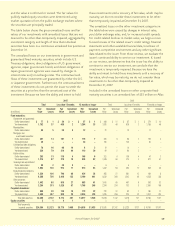
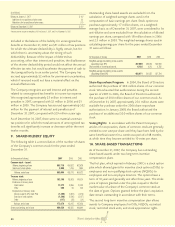
The table below shows the gross unrealized losses and fair
values of our investments with unrealized losses that are not
deemed to be other-than-temporarily impaired, aggregated by
investment category and length of time that individual
securities have been in a continuous unrealized loss position at
December 31.
The unrealized losses on our investments in government and
guaranteed fixed-maturity securities, which include U.S.
Treasury obligations, direct obligations of U.S. government
agencies, Japan government bonds, and direct obligations of
Japan government agencies were caused by changes in
interest rates and/or exchange rates. The contractual cash
flows of these investments are guaranteed by either the U.S.
or Japanese government. Furthermore, the contractual terms
of these investments do not permit the issuer to settle the
securities at a price less than the amortized cost of the
investment. Because we have the ability and intent to hold
these investments until a recovery of fair value, which may be
maturity, we do not consider these investments to be other-
than-temporarily impaired at December 31, 2007.
The unrealized losses on the other investment categories in
the table below were caused by changes in interest rates,
yen/dollar exchange rates, and/or increased credit spreads.
For credit-related declines in market value, we begin a more
focused review of the related issuer’s credit ratings, financial
statements and other available financial data, timeliness of
payment, competitive environment and any other significant
data related to the issuer. From those reviews, we evaluate the
issuer's continued ability to service our investment. If, based
on our reviews, we determine that the issuer has the ability to
continue to service our investment, we conclude that the
investment is temporarily impaired. Because we have the
ability and intent to hold these investments until a recovery of
fair value, which may be maturity, we do not consider these
investments to be other-than-temporarily impaired at
December 31, 2007.
Included in the unrealized losses on other corporate fixed-
maturity securities is an unrealized loss of $33 million on Aflac
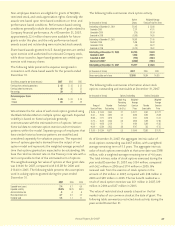
2007 2006
Total Less than 12 months 12 months or longer Total Less than 12 months 12 months or longer
Fair Unrealized Fair Unrealized Fair Unrealized Fair Unrealized Fair Unrealized Fair Unrealized
(In millions) Value Losses Value Losses Value Losses Value Losses Value Losses Value Losses
Fixed maturities:
Government and guaranteed:
Dollar-denominated $77$1$20 $– $57$1 $ 366 $ 11 $ 87 $ 1 $ 279 $ 10
Yen-denominated 1,752 37 458 2 1,294 35 1,815 48 626 2 1,189 46
Municipalities:
Dollar-denominated 62 5 50 5 12 – 21 – 10 – 11 –
Mortgage- and
asset-backed securities:
Dollar-denominated 297 14 181 7 116 7 205 6 96 2 109 4
Yen-denominated 30 – – – 30 – 165 – 135 – 30 –
Collateralized debt obligations:
Dollar-denominated 76 16 68 14 8 2 10 – 10 – – –
Yen-denominated 324 79 214 49 110 30 90 2 90 2 – –
Public utilities:
Dollar-denominated 283 13 115 4 168 9 203 6 156 4 47 2
Yen-denominated 1,314 97 379 15 935 82 1,346 64 375 3 971 61
Sovereign and supranational:
Dollar-denominated 28 2 28 2 – – 6– 6– ––
Yen-denominated 1,884 100 974 17 910 83 1,442 56 494 10 948 46
Banks/financial institutions:
Dollar-denominated 1,220 106 796 68 424 38 865 21 681 13 184 8
Yen-denominated 8,588 756 3,408 155 5,180 601 6,030 386 1,502 48 4,528 338
Other corporate:
Dollar-denominated 1,402 88 819 27 583 61 1,043 60 481 8 562 52
Yen-denominated 3,294 313 1,528 67 1,766 246 2,244 204 153 5 2,091 199
Perpetual debentures:
Dollar-denominated 295 38 125 16 170 22 272 12 92 1 180 11
Yen-denominated 3,463 457 609 39 2,854 418 3,255 266 224 32 3,031 234
Total debt securities 24,389 2,122 9,772 487 14,617 1,635 19,378 1,142 5,218 131 14,160 1,011
Equity securities 5 1 4 1 1 – 3– 2– 1–
Total temporarily
impaired securities $ 24,394 $ 2,123 $ 9,776 $ 488 $ 14,618 $1,635 $ 19,381 $ 1,142 $ 5,220 $ 131 $ 14,161 $ 1,011