Aflac 2007 Annual Report Download - page 61
Download and view the complete annual report
Please find page 61 of the 2007 Aflac annual report below. You can navigate through the pages in the report by either clicking on the pages listed below, or by using the keyword search tool below to find specific information within the annual report.-
 1
1 -
2
-
3
-
4
-
5
-
6
-
7
-
8
-
9
-
10
-
11
-
12
-
13
-
14
-
15
-
16
-
17
-
18
-
19
-
20
-
21
-
22
-
23
-
24
-
25
-
26
-
27
-
28
-
29
-
30
-
31
-
32
-
33
-
34
-
35
-
36
-
37
-
38
-
39
-
40
-
41
-
42
-
43
-
44
-
45
-
46
-
47
-
48
-
49
-
50
-
 51
51 -
 52
52 -
 53
53 -
 54
54 -
 55
55 -
 56
56 -
 57
57 -
 58
58 -
 59
59 -
 60
60 -
 61
61 -
 62
62 -
 63
63 -
 64
64 -
 65
65 -
 66
66 -
 67
67 -
 68
68 -
 69
69 -
 70
70 -
 71
71 -
72
-
73
-
74
-
75
-
76
-
77
-
78
-
79
-
80
-
81
-
82
 |
 |

57
Annual Report for 2007
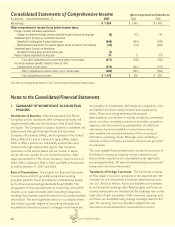
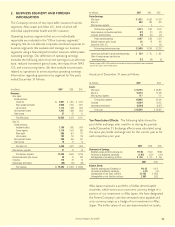
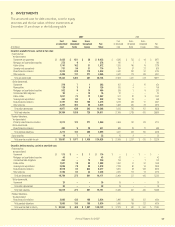
3. INVESTMENTS
The amortized cost for debt securities, cost for equity
securities and the fair values of these investments at
December 31 are shown in the following table.
2007 2006
Cost Gross Gross Cost Gross Gross
or Amortized Unrealized Unrealized Fair or Amortized Unrealized Unrealized Fair
(In millions) Cost Gains Losses Value Cost Gains Losses Value
Securities available for sale, carried at fair value:
Fixed maturities:
Yen-denominated:
Government and guaranteed $ 8,438 $ 621 $ 36 $ 9,023 $ 8,286 $ 733 $ 48 $ 8,971
Mortgage- and asset-backed securities 272 6 – 278 190 1 1 190
Public utilities 1,741 162 31 1,872 1,575 165 14 1,726
Sovereign and supranational 751 54 31 774 794 57 22 829
Banks/financial institutions 3,814 228 112 3,930 3,482 292 50 3,724
Other corporate 4,406 131 271 4,266 3,547 173 183 3,537
Total yen-denominated 19,422 1,202 481 20,143 17,874 1,421 318 18,977
Dollar-denominated:
Government 376 7 1 382 431 3 10 424
Municipalities 128 3 5 126 105 4 – 109
Mortgage- and asset-backed securities 502 6 14 494 356 3 6 353
Collateralized debt obligations 92 – 16 76 20 – – 20
Public utilities 1,007 73 13 1,067 921 87 6 1,002
Sovereign and supranational 424 80 2 502 394 74 – 468
Banks/financial institutions 3,157 165 106 3,216 3,329 229 21 3,537
Other corporate 4,291 302 88 4,505 3,669 305 59 3,915
Total dollar-denominated 9,977 636 245 10,368 9,225 705 102 9,828
Total fixed maturities 29,399 1,838 726 30,511 27,099 2,126 420 28,805
Perpetual debentures:
Yen-denominated:
Primarily banks/financial institutions 3,812 123 271 3,664 3,656 197 143 3,710
Dollar-denominated:
Banks/financial institutions 460 9 38 431 685 25 12 698
Total perpetual debentures 4,272 132 309 4,095 4,341 222 155 4,408
Equity securities 16 7 1 22 16 9 – 25
Total securities available for sale $ 33,687 $ 1,977 $ 1,036 $ 34,628 $ 31,456 $ 2,357 $ 575 $ 33,238
Securities held to maturity, carried at amortized cost:
Fixed maturities:
Yen-denominated:
Government $ 175 $ – $ 1 $ 174 $–$–$–$–
Mortgage- and asset-backed securities 43 – – 43 42 – – 42
Collateralized debt obligations 403 – 79 324 134 – 2 132
Public utilities 1,937 18 66 1,889 1,567 31 50 1,548
Sovereign and supranational 3,069 78 69 3,078 2,783 90 35 2,838
Banks/financial institutions 8,976 85 644 8,417 6,913 98 336 6,675
Other corporate 2,196 92 42 2,246 2,025 112 22 2,115
Total yen-denominated 16,799 273 901 16,171 13,464 331 445 13,350
Dollar-denominated:
Government 20 – – 20 19 – – 19
Total dollar-denominated 20 – – 20 19 – – 19
Total fixed maturities 16,819 273 901 16,191 13,483 331 445 13,369
Perpetual debentures:
Yen-denominated:
Banks/financial institutions 3,985 135 186 3,934 3,990 156 122 4,024
Total perpetual debentures 3,985 135 186 3,934 3,990 156 122 4,024
Total securities held to maturity $ 20,804 $ 408 $ 1,087 $ 20,125 $ 17,473 $ 487 $ 567 $ 17,393