Aflac 2007 Annual Report Download - page 59
Download and view the complete annual report
Please find page 59 of the 2007 Aflac annual report below. You can navigate through the pages in the report by either clicking on the pages listed below, or by using the keyword search tool below to find specific information within the annual report.-
 1
1 -
2
-
3
-
4
-
5
-
6
-
7
-
8
-
9
-
10
-
11
-
12
-
13
-
14
-
15
-
16
-
17
-
18
-
19
-
20
-
21
-
22
-
23
-
24
-
25
-
26
-
27
-
28
-
29
-
30
-
31
-
32
-
33
-
34
-
35
-
36
-
37
-
38
-
39
-
40
-
41
-
42
-
43
-
44
-
45
-
46
-
47
-
48
-
 49
49 -
 50
50 -
 51
51 -
 52
52 -
 53
53 -
 54
54 -
 55
55 -
 56
56 -
 57
57 -
 58
58 -
 59
59 -
 60
60 -
 61
61 -
 62
62 -
 63
63 -
 64
64 -
 65
65 -
 66
66 -
 67
67 -
 68
68 -
 69
69 -
70
-
71
-
72
-
73
-
74
-
75
-
76
-
77
-
78
-
79
-
80
-
81
-
82
 |
 |

55
Annual Report for 2007
2. BUSINESS SEGMENT AND FOREIGN
INFORMATION
The Company consists of two reportable insurance business
segments: Aflac Japan and Aflac U.S., both of which sell
individual supplemental health and life insurance.
Operating business segments that are not individually
reportable are included in the “Other business segments”
category. We do not allocate corporate overhead expenses to
business segments. We evaluate and manage our business
segments using a financial performance measure called pretax
operating earnings. Our definition of operating earnings
excludes the following items from net earnings on an after-tax
basis: realized investment gains/losses, the impact from SFAS
133, and nonrecurring items. We then exclude income taxes
related to operations to arrive at pretax operating earnings.
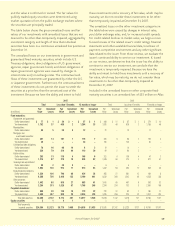
Information regarding operations by segment for the years
ended December 31 follows:
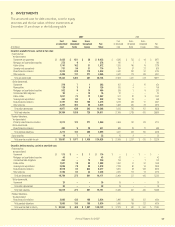
(In millions) 2007 2006 2005
Revenues:
Aflac Japan:
Earned premiums:
Cancer life $ 4,937 $ 4,923 $ 5,147
Other accident and health 2,928 2,755 2,577
Life insurance 1,172 1,084 1,021
Net investment income 1,801 1,688 1,635
Other income 27 25 31
Total Aflac Japan 10,865 10,475 10,411
Aflac U.S.:
Earned premiums:
Accident/disability 1,785 1,580 1,424
Cancer expense 1,114 1,041 982
Other health 885 801 721
Life insurance 152 130 118
Net investment income 500 465 421
Other income 10 10 10
Total Aflac U.S. 4,446 4,027 3,676
Other business segments 37 42 39
Total business segments 15,348 14,544 14,126
Realized investment gains (losses) 28 79 262
Corporate 116 87 74
Intercompany eliminations (99) (94) (99)
Total revenues $ 15,393 $ 14,616 $ 14,363
(In millions) 2007 2006 2005
Pretax Earnings:
Aflac Japan $ 1,821 $ 1,652 $ 1,515 *
Aflac U.S. 692 585 525
Other business segments –5–
Total business segments 2,513 2,242 2,040
Interest expense, noninsurance operations (21) (17) (20)
Corporate and eliminations (25) (40) (41)
Pretax operating earnings 2,467 2,185 1,979
Realized investment gains (losses) 28 79 262
Impact from SFAS 133 4– (15)
Total earnings before income taxes $ 2,499 $ 2,264 $ 2,226
Income taxes applicable to pretax operating earnings $ 854 $ 753 $ 687
Effect of foreign currency translation on
operating earnings (11) (39) (8)
*Includes charges of $46 in 2005 related to the write-down of previously capitalized systems development
costs for Aflac Japan’s administration system.
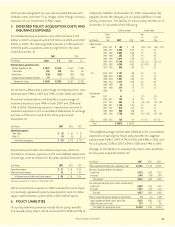
Assets as of December 31 were as follows:
(In millions) 2007 2006
Assets:
Aflac Japan $ 54,153 $ 48,850
Aflac U.S. 10,415 10,249
Other business segments 117 110
Total business segments 64,685 59,209
Corporate 10,364 10,023
Intercompany eliminations (9,244) (9,427)
Total assets $ 65,805 $ 59,805
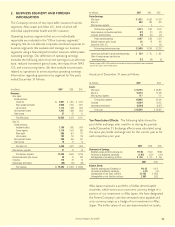
Yen-Translation Effects: The following table shows the
yen/dollar exchange rates used for or during the periods
ended December 31. Exchange effects were calculated using
the same yen/dollar exchange rate for the current year as for
each respective prior year.
2007 2006 2005
Statements of Earnings:
Weighted-average yen/dollar exchange rate 117.93 116.31 109.88
Yen percent strengthening (weakening) (1.4)% (5.5)% (1.5)%
Exchange effect on net earnings (millions) $ (10) $ (41) $ (16)
2007 2006
Balance Sheets:
Yen/dollar exchange rate at December 31 114.15 119.11
Yen percent strengthening (weakening) 4.3% (.9)%
Exchange effect on total assets (millions) $ 2,102 $ (400)
Exchange effect on total liabilities (millions) 2,063 (392)
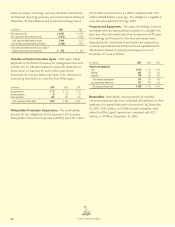
Aflac Japan maintains a portfolio of dollar-denominated
securities, which serves as an economic currency hedge of a
portion of our investment in Aflac Japan. We have designated
the Parent Company’s yen-denominated notes payable and
cross-currency swaps as a hedge of our investment in Aflac
Japan. The dollar values of our yen-denominated net assets,