Aflac 2007 Annual Report Download - page 38
Download and view the complete annual report
Please find page 38 of the 2007 Aflac annual report below. You can navigate through the pages in the report by either clicking on the pages listed below, or by using the keyword search tool below to find specific information within the annual report.-
 1
1 -
2
-
3
-
4
-
5
-
6
-
7
-
8
-
9
-
10
-
11
-
12
-
13
-
14
-
15
-
16
-
17
-
18
-
19
-
20
-
21
-
22
-
23
-
24
-
25
-
26
-
27
-
 28
28 -
 29
29 -
 30
30 -
 31
31 -
 32
32 -
 33
33 -
 34
34 -
 35
35 -
 36
36 -
 37
37 -
 38
38 -
 39
39 -
 40
40 -
 41
41 -
 42
42 -
 43
43 -
 44
44 -
 45
45 -
 46
46 -
 47
47 -
 48
48 -
49
-
50
-
51
-
52
-
53
-
54
-
55
-
56
-
57
-
58
-
59
-
60
-
61
-
62
-
63
-
64
-
65
-
66
-
67
-
68
-
69
-
70
-
71
-
72
-
73
-
74
-
75
-
76
-
77
-
78
-
79
-
80
-
81
-
82
 |
 |

34 There’s Only One Aflac
using the December 31, 2007, period-end
exchange rate) of underpaid claims in
April, and we revised the amount to ¥2.1
billion (approximately $18.4 million using
the December 31, 2007, period-end
exchange rate) in October. We are using
this review to identify process changes
that will help ensure that payment errors
such as these are not repeated. The
financial impact of paying the claims that
were in error was immaterial to our
operations and has been provided for in
our 2007 and 2006 financial statements
as applicable.
We expect that our distribution system
will continue to evolve in Japan.
Regulatory changes that took effect in
December 2007 enable banks to sell our
products to their customers. We believe
that it will take time for momentum to
build in the bank channel for selling third
sector products. However, our strong brand as the leading
seller of cancer and medical insurance products in Japan and
our extensive, long-standing relationships with more than
60% of Japan’s banks place us in a strong position to sell
through this new channel. By the end of January 2008, we had
agreements with 41 banks to market Aflac's products through
more than 3,300 branches nationwide.
In October 2005, legislation aimed at privatizing Japan’s postal
system (Japan Post) was enacted into law. The privatization
laws split Japan Post into four entities that began operating in
October 2007. The four entities are Japan Post Service Co.,
Ltd.; Japan Post Network Co., Ltd.; Japan Post Bank Co., Ltd.;
and Japan Post Insurance Co., Ltd. In November 2007, Japan
Post Network Co. selected Aflac Japan as its provider of cancer
insurance to be sold through Japan’s vast post office network.
Japan Post Network Co. operates the 24,000 post offices
located throughout Japan, providing a significant opportunity
for us to reach new consumers.
AFLAC U.S. SEGMENT
Aflac U.S. Pretax Operating Earnings
Changes in Aflac U.S. pretax operating earnings and profit
margins are primarily affected by morbidity, mortality,
expenses, persistency and investment yields. The table at the
top of this page presents a summary of operating results for
Aflac U.S.
The percentage increases in premium income reflect the
growth of premiums in force. The increases in annualized
premiums in force of 10.0% in 2007, 10.5% in 2006, and
10.0% in 2005 were favorably affected by increased sales at the
worksite primarily through cafeteria plans and a slight
improvement in the persistency of several products. Annualized
premiums in force at December 31 were $4.5 billion in 2007,
compared with $4.1 billion in 2006 and $3.7 billion in 2005.
Net investment income is expected to be flat for 2008
compared with 2007 due to the transfer of approximately
$450 million to the Parent Company from Aflac U.S. to support
the expected increase in share repurchases in 2008.
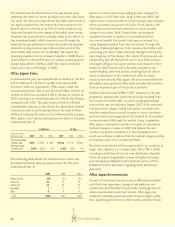
The following table presents a summary of operating ratios for
Aflac U.S.
After several years of trending upward, the benefit ratio
declined in 2007 and 2006, primarily reflecting favorable claim
cost trends on our major product lines. We expect the benefit
ratio, operating expense ratio, and pretax operating profit
margin to remain relatively stable in 2008.
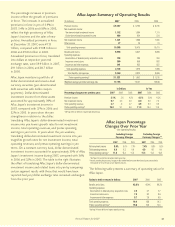
Aflac U.S. Summary of Operating Results
(In millions) 2007 2006 2005
Premium income $ 3,936 $ 3,552 $ 3,245
Net investment income 500 465 421
Other income 10 10 10
Total operating revenues 4,446 4,027 3,676
Benefits and claims 2,350 2,169 1,991
Operating expenses:
Amortization of deferred policy acquisition costs 323 290 258
Insurance commissions 481 444 410
Insurance and other expenses 600 539 492
Total operating expenses 1,404 1,273 1,160
Total benefits and expenses 3,754 3,442 3,151
Pretax operating earnings* $ 692 $ 585 $ 525
Percentage changes over previous year:
Premium income 10.8% 9.5% 10.6%
Net investment income 7.5 10.4 6.5
Total operating revenues 10.4 9.5 10.0
Pretax operating earnings* 18.3 11.4 5.6
*See Page 30 for our definition of segment operating earnings.
Ratios to total revenues: 2007 2006 2005
Benefits and claims 52.9% 53.9% 54.2%
Operating expenses:
Amortization of deferred policy acquisition costs 7.3 7.2 7.0
Insurance commissions 10.8 11.0 11.2
Insurance and other expenses 13.4 13.4 13.3
Total operating expenses 31.5 31.6 31.5
Pretax operating earnings* 15.6 14.5 14.3
*See Page 30 for our definition of segment operating earnings.