Aflac 2007 Annual Report Download - page 12
Download and view the complete annual report
Please find page 12 of the 2007 Aflac annual report below. You can navigate through the pages in the report by either clicking on the pages listed below, or by using the keyword search tool below to find specific information within the annual report.-
 1
1 -
 2
2 -
 3
3 -
 4
4 -
 5
5 -
 6
6 -
 7
7 -
 8
8 -
 9
9 -
 10
10 -
 11
11 -
 12
12 -
 13
13 -
 14
14 -
 15
15 -
 16
16 -
 17
17 -
 18
18 -
 19
19 -
 20
20 -
 21
21 -
 22
22 -
23
-
24
-
25
-
26
-
27
-
28
-
29
-
30
-
31
-
32
-
33
-
34
-
35
-
36
-
37
-
38
-
39
-
40
-
41
-
42
-
43
-
44
-
45
-
46
-
47
-
48
-
49
-
50
-
51
-
52
-
53
-
54
-
55
-
56
-
57
-
58
-
59
-
60
-
61
-
62
-
63
-
64
-
65
-
66
-
67
-
68
-
69
-
70
-
71
-
72
-
73
-
74
-
75
-
76
-
77
-
78
-
79
-
80
-
81
-
82
 |
 |

Overcoming Obstacles
and Meeting Targets
Aflac Japan is no stranger to overcoming
challenges, and 2007 was no exception.
Following disappointing sales in 2006,
our primary task was to turn sales around
in 2007 despite a challenging market
environment. And like 2006, the market
was cluttered with competing medical
products. Consumer confidence also
remained weak in light of claims payment
errors that plagued the life insurance
industry. Reflecting this challenging
environment, sales declined in the first half
of the year. As we expected, sales turned
positive in the second half of the year, and
we again retained the distinction of being
the number one seller of both cancer life
and medical insurance policies in Japan.
Our persistency was again strong and
stable, and our new money investment
yields were ahead of target. Most
important, our financial performance
was consistent with our expectations.
Following are some financial highlights
from 2007:
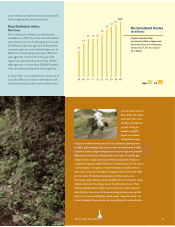
•Premium income rose 4.3% to ¥1.1 trillion,
compared with ¥1.0 trillion in 2006.
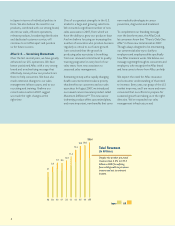
•Total revenues increased 4.9% to ¥1.3 trillion,
compared with ¥1.2 trillion a year ago.
•Pretax operating earnings rose 11.8% from
¥192.1 billion in 2006 to ¥214.7 billion
in 2007.
The Impact of the
Yen/Dollar Exchange Rate
Aflac Japan collects premiums in yen, pays
benefits and expenses in yen and primarily
holds yen-denominated assets to support
yen-denominated liabilities. With the
exception of a limited number of trans-
actions, we do not convert yen into dollars.
Therefore, currency changes do not have a
material effect on Aflac in economic terms.
However, for financial reporting purposes,
we are required to translate Aflac Japan’s
income statement from yen into dollars
using an average exchange rate. And since
Aflac Japan is responsible for the majority of
consolidated revenues and pretax operating
earnings, fluctuations in the value of the yen
can significantly affect our results as reported
in dollars.
Translating Aflac Japan’s results from yen
into dollars means that growth rates are
magnified in dollar terms when the average
yen/dollar exchange rate is stronger than
the preceding year. Conversely, growth rates
in dollar terms are lower when the yen is
weaker to the dollar in comparison with the
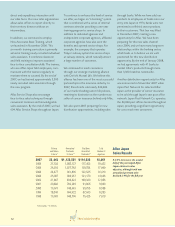
preceding year. In 2007, the yen averaged
117.93 to the dollar, or 1.4% weaker than
the average of 116.31 in 2006, suppressing
our reported results in dollar terms.
•Premium income rose 3.1% to $9.0 billion, up
from $8.8 billion in 2006.
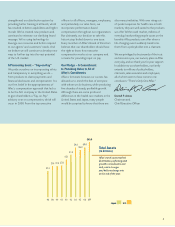
•Total revenues were up 3.7% to $10.9 billion,
compared with $10.5 billion in 2006.
•Pretax operating earnings increased 10.2% to
$1.8 billion from $1.7 billion in 2006.
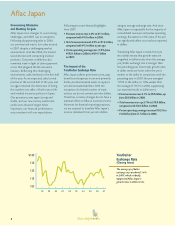
Aflac Japan
8
98 99 00 01 02 03 04 05 06 07
100
110
120
130
¥140
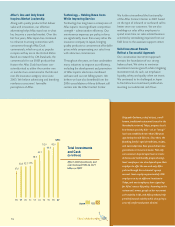
Yen/Dollar
Exchange Rate
(Closing rates)
The average yen/dollar
exchange rate weakened 1.4%
in 2007, which modestly
suppressed Aflac Japan’s
growth rates in dollar terms.
There’s Only One Aflac