Aflac 2007 Annual Report Download - page 42
Download and view the complete annual report
Please find page 42 of the 2007 Aflac annual report below. You can navigate through the pages in the report by either clicking on the pages listed below, or by using the keyword search tool below to find specific information within the annual report.-
 1
1 -
2
-
3
-
4
-
5
-
6
-
7
-
8
-
9
-
10
-
11
-
12
-
13
-
14
-
15
-
16
-
17
-
18
-
19
-
20
-
21
-
22
-
23
-
24
-
25
-
26
-
27
-
28
-
29
-
30
-
31
-
 32
32 -
 33
33 -
 34
34 -
 35
35 -
 36
36 -
 37
37 -
 38
38 -
 39
39 -
 40
40 -
 41
41 -
 42
42 -
 43
43 -
 44
44 -
 45
45 -
 46
46 -
 47
47 -
 48
48 -
 49
49 -
 50
50 -
 51
51 -
 52
52 -
53
-
54
-
55
-
56
-
57
-
58
-
59
-
60
-
61
-
62
-
63
-
64
-
65
-
66
-
67
-
68
-
69
-
70
-
71
-
72
-
73
-
74
-
75
-
76
-
77
-
78
-
79
-
80
-
81
-
82
 |
 |

38
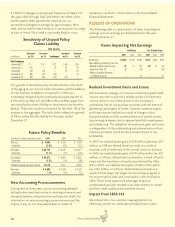
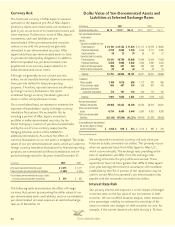
reflects the characteristics of the liabilities it supports. Aflac
invests primarily within the debt securities markets.
The following table details investment securities by segment
as of December 31.
We have investments in both publicly and privately issued
securities. However, the status of issuance should not be
viewed as an indicator of liquidity or as a limitation on the
determination of fair value. The outstanding amount of a
particular issuance, as well as the level of activity in a particular
issuance and market conditions, including credit events and the
interest rate environment, affect liquidity regardless of type of
issuance. We routinely assess the fair value of all of our
investments. This process includes evaluating quotations
provided by outside securities pricing sources and/or compiled
using data provided by external debt and equity market
sources, as described more fully in Note 3 of the Notes to the
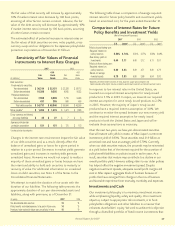
Consolidated Financial Statements. The following table details
investment securities by type of issuance as of December 31.
Privately issued securities accounted for 70.3% of total debt
securities, at amortized cost, at December 31, 2007, compared
with 68.8% at December 31, 2006. Privately issued securities
held by Aflac Japan at amortized cost accounted for $36.0
billion, or 66.0%, of total debt securities at December 31,
2007, compared with $31.3 billion, or 64.0%, of total debt
securities at December 31, 2006. Reverse-dual currency debt
securities accounted for $11.1 billion, or 29.2%, of total
privately issued securities at December 31, 2007, compared
with $9.7 billion, or 28.9%, of total privately issued securities
at December 31, 2006. Aflac Japan has invested in privately
issued securities to secure higher yields than those available
from Japanese government bonds. Aflac Japan’s investments
in yen-denominated privately issued securities consist
primarily of non-Japanese issuers and have longer maturities,
thereby allowing us to improve our asset/liability matching
and our overall investment returns. Most of our privately
issued securities are issued under medium-term note
programs and have standard documentation, except when
internal credit analysis indicates that additional protective
and/or event-risk covenants are required.
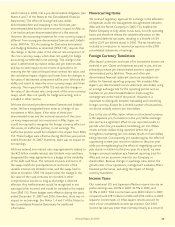
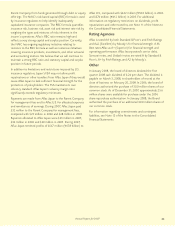
Our investment activities expose us to credit risk, which is a
consequence of extending credit and/or carrying investment
positions. However, we continue to adhere to prudent
standards for credit quality. We accomplish this by considering
our product needs and overall corporate objectives, in
addition to credit risk. In evaluating the initial rating, we look
at the overall senior issuer rating, the explicit rating for the
actual issue or the rating for the security class, and, where
applicable, the appropriate designation from the Securities
Valuation Office (SVO) of the National Association of
Insurance Commissioners (NAIC). All of our securities have
ratings from either a nationally recognized statistical rating
organization or the SVO of the NAIC. In addition, we perform
extensive internal credit reviews to ensure that we are
consistent in applying rating criteria for all of our securities. In
light of recent market activity surrounding the subprime
lending market, we have performed a review of our
investment portfolio. We have no direct investment exposure
to the subprime lending market and have not identified any
material indirect exposure to that market.
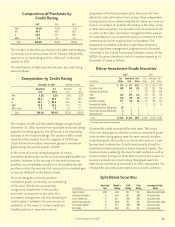
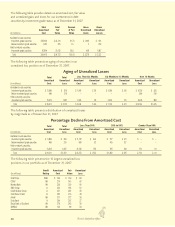
We use specific criteria to judge the credit quality of both
existing and prospective investments. Furthermore, we use
several methods to monitor these criteria, including credit
rating services and internal credit analysis. The distributions by
credit rating of our purchases of debt securities for the years
ended December 31, based on acquisition cost, were as
follows:
There’s Only One Aflac
Investment Securities by Segment
Aflac Japan Aflac U.S.
(In millions) 2007 2006 2007 2006
Securities available for sale,
at fair value:
Fixed maturities $ 23,532 $ 22,044 $ 6,874* $ 6,659*
Perpetual debentures 3,764 3,935 331 473
Equity securities 22 25 ––
Total available for sale 27,318 26,004 7,205 7,132
Securities held to maturity,
at amortized cost:
Fixed maturities 16,799 13,464 20 19
Perpetual debentures 3,985 3,990 ––
Total held to maturity 20,784 17,454 20 19
Total investment securities $ 48,102 $ 43,458 $ 7,225 $ 7,151
*Excludes investment-grade, available-for-sale fixed-maturity securities held by the Parent Company of $105 in
2007 and $102 in 2006.
Investment Securities by Type of Issuance
2007 2006
Amortized Fair Amortized Fair
(In millions) Cost Value Cost Value
Publicly issued securities:
Fixed maturities $ 15,986 $ 16,919 $ 15,092 $ 16,269
Perpetual debentures 173 157 173 176
Equity securities 13 19 13 22
Total publicly issued 16,172 17,095 15,278 16,467
Privately issued securities:
Fixed maturities 30,232 29,783 25,490 25,905
Perpetual debentures 8,084 7,872 8,158 8,256
Equity securities 3333
Total privately issued 38,319 37,658 33,651 34,164
Total investment securities $ 54,491 $ 54,753 $ 48,929 $ 50,631