Aflac 2007 Annual Report Download - page 34
Download and view the complete annual report
Please find page 34 of the 2007 Aflac annual report below. You can navigate through the pages in the report by either clicking on the pages listed below, or by using the keyword search tool below to find specific information within the annual report.-
 1
1 -
2
-
3
-
4
-
5
-
6
-
7
-
8
-
9
-
10
-
11
-
12
-
13
-
14
-
15
-
16
-
17
-
18
-
19
-
20
-
21
-
22
-
23
-
 24
24 -
 25
25 -
 26
26 -
 27
27 -
 28
28 -
 29
29 -
 30
30 -
 31
31 -
 32
32 -
 33
33 -
 34
34 -
 35
35 -
 36
36 -
 37
37 -
 38
38 -
 39
39 -
 40
40 -
 41
41 -
 42
42 -
 43
43 -
 44
44 -
45
-
46
-
47
-
48
-
49
-
50
-
51
-
52
-
53
-
54
-
55
-
56
-
57
-
58
-
59
-
60
-
61
-
62
-
63
-
64
-
65
-
66
-
67
-
68
-
69
-
70
-
71
-
72
-
73
-
74
-
75
-
76
-
77
-
78
-
79
-
80
-
81
-
82
 |
 |

30
the release of the valuation allowance for non-life losses
discussed previously. See Note 8 of the Notes to the
Consolidated Financial Statements for additional information.
Earnings Guidance
We communicate earnings guidance in this report based on
the growth in net earnings per diluted share. However, certain
items that cannot be predicted or that are outside of
management’s control may have a significant impact on actual
results. Therefore, our comparison of net earnings includes
certain assumptions to reflect the limitations that are inherent
in projections of net earnings. In comparing year-over-year
results, we exclude the effect of realized investment gains and
losses, the impact from SFAS 133 and nonrecurring items. We
also assume no impact from foreign currency translation on
the Aflac Japan segment and the Parent Company’s yen-
denominated interest expense for a given year in relation to
the prior year.
Subject to the preceding assumptions, our objective for 2007
was to increase net earnings per diluted share by 15% to 16%
over 2006. We reported 2007 net earnings per diluted share
of $3.31. Adjusting that number for realized investment gains
($.04 per diluted share), the impact from SFAS 133 (nil per
diluted share) and foreign currency translation (a loss of $.02
per diluted share), we met our objective for the year.
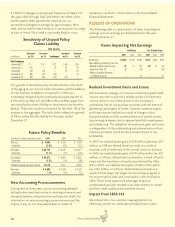
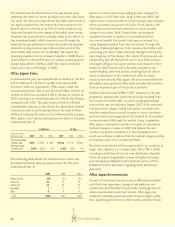
Our objective for 2008 is to increase net earnings per diluted
share by 13% to 15% over 2007, on the basis described above.
If we achieve this objective, the following table shows the
likely results for 2008 net earnings per diluted share, including
the impact of foreign currency translation using various
yen/dollar exchange rate scenarios.
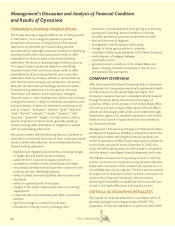
INSURANCE OPERATIONS
Aflac’s insurance business consists of two segments: Aflac
Japan and Aflac U.S. Aflac Japan, which operates as a branch
of Aflac, is the principal contributor to consolidated earnings.
GAAP financial reporting requires that a company report
financial and descriptive information about operating
segments in its annual financial statements. Furthermore, we
are required to report a measure of segment profit or loss,
certain revenue and expense items, and segment assets.
We measure and evaluate our insurance segments’ financial
performance using operating earnings on a pretax basis. We
define segment operating earnings as the profits we derive
from our operations before realized investment gains and
losses, the impact from SFAS 133, and nonrecurring items. We
believe that an analysis of segment pretax operating earnings
is vitally important to an understanding of the underlying
profitability drivers and trends of our insurance business.
Furthermore, because a significant portion of our business is
conducted in Japan, we believe it is equally important to
understand the impact of translating Japanese yen into U.S.
dollars.
We evaluate our sales efforts using new annualized premium
sales. Total new annualized premium sales, which include new
sales and the incremental increase in premiums due to
conversions, represent the premiums that we would collect
over a 12-month period, assuming the policies remain in force.
For Aflac Japan, total new annualized premium sales are
determined by applications written during the reporting
period. For Aflac U.S., total new annualized premium sales are
determined by applications that are accepted during the
reporting period. Premium income, or earned premiums, is a
financial performance measure that reflects collected or due
premiums that have been earned ratably on policies in force
during the reporting period.
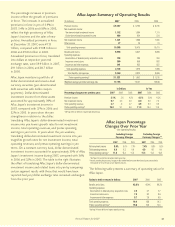
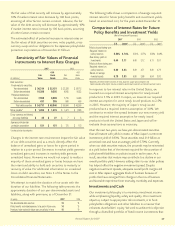
AFLAC JAPAN SEGMENT
Aflac Japan Pretax Operating Earnings
Changes in Aflac Japan’s pretax operating earnings and profit
margins are primarily affected by morbidity, mortality,
expenses, persistency and investment yields. The table at the
top of the following page presents a summary of operating
results for Aflac Japan.
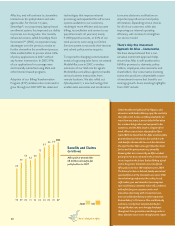
There’s Only One Aflac
2008 Net Earnings Per Share (EPS) Scenarios*
Weighted-Average Net Earnings
Yen/Dollar Per % Growth Yen Impact
Exchange Rate Diluted Share Over 2007 on EPS
105.00 $ 3.92 - 3.98 19.9 - 21.7% $ .22
110.00 3.83 - 3.89 17.1 - 19.0 .13
115.00 3.75 - 3.81 14.7 - 16.5 .05
117.93** 3.70 - 3.76 13.1 - 15.0 –
120.00 3.67 - 3.73 12.2 - 14.1 (.03)
125.00 3.60 - 3.66 10.1 - 11.9 (.10)
*Excludes realized investment gains/losses, impact from SFAS 133 and nonrecurring items in 2008 and 2007
**Actual 2007 weighted-average exchange rate