Aflac 2007 Annual Report Download - page 35
Download and view the complete annual report
Please find page 35 of the 2007 Aflac annual report below. You can navigate through the pages in the report by either clicking on the pages listed below, or by using the keyword search tool below to find specific information within the annual report.-
 1
1 -
2
-
3
-
4
-
5
-
6
-
7
-
8
-
9
-
10
-
11
-
12
-
13
-
14
-
15
-
16
-
17
-
18
-
19
-
20
-
21
-
22
-
23
-
24
-
 25
25 -
 26
26 -
 27
27 -
 28
28 -
 29
29 -
 30
30 -
 31
31 -
 32
32 -
 33
33 -
 34
34 -
 35
35 -
 36
36 -
 37
37 -
 38
38 -
 39
39 -
 40
40 -
 41
41 -
 42
42 -
 43
43 -
 44
44 -
 45
45 -
46
-
47
-
48
-
49
-
50
-
51
-
52
-
53
-
54
-
55
-
56
-
57
-
58
-
59
-
60
-
61
-
62
-
63
-
64
-
65
-
66
-
67
-
68
-
69
-
70
-
71
-
72
-
73
-
74
-
75
-
76
-
77
-
78
-
79
-
80
-
81
-
82
 |
 |

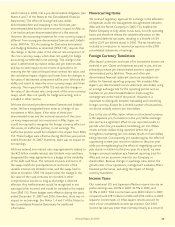
The percentage increases in premium
income reflect the growth of premiums
in force. The increases in annualized
premiums in force in yen of 3.9% in
2007, 5.4% in 2006 and 6.8% in 2005,
reflect the high persistency of Aflac
Japan’s business and the sales of new
policies. Annualized premiums in force
at December 31, 2007, were ¥1.13
trillion, compared with ¥1.08 trillion in
2006 and ¥1.03 trillion in 2005.
Annualized premiums in force, translated
into dollars at respective year-end
exchange rates, were $9.9 billion in 2007,
$9.1 billion in 2006, and $8.7 billion
in 2005.
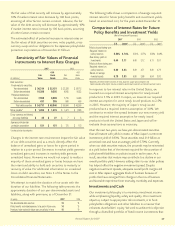
Aflac Japan maintains a portfolio of
dollar-denominated and reverse-dual
currency securities (yen-denominated
debt securities with dollar coupon
payments). Dollar-denominated
investment income from these assets
accounted for approximately 39% of
Aflac Japan’s investment income in
2007, compared with 37% in 2006 and
32% in 2005. In years when the yen
strengthens in relation to the dollar,
translating Aflac Japan’s dollar-denominated investment
income into yen lowers growth rates for net investment
income, total operating revenues, and pretax operating
earnings in yen terms. In years when the yen weakens,
translating dollar-denominated investment income into yen
magnifies growth rates for net investment income, total
operating revenues, and pretax operating earnings in yen
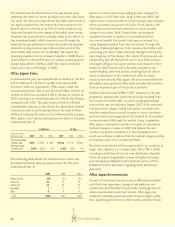
terms. On a constant currency basis, dollar-denominated
investment income accounted for approximately 39% of Aflac
Japan’s investment income during 2007, compared with 36%
in 2006 and 32% in 2005. The table to the right illustrates
the effect of translating Aflac Japan’s dollar-denominated
investment income and related items into yen by comparing
certain segment results with those that would have been
reported had yen/dollar exchange rates remained unchanged
from the prior year.
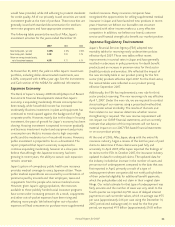
The following table presents a summary of operating ratios for
Aflac Japan.
31
Annual Report for 2007
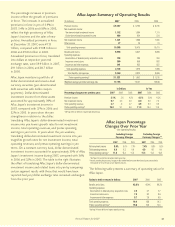
Aflac Japan Summary of Operating Results
(In millions) 2007 2006 2005
Premium income $ 9,037 $ 8,762 $ 8,745
Net investment income:
Yen-denominated investment income 1,102 1,064 1,111
Dollar-denominated investment income 699 624 524
Net investment income 1,801 1,688 1,635
Other income 27 25 31
Total operating revenues 10,865 10,475 10,411
Benefits and claims 6,935 6,847 6,898
Operating expenses:
Amortization of deferred policy acquisition costs 318 285 284
Insurance commissions 850 859 892
Insurance and other expenses 941 832 822
Total operating expenses 2,109 1,976 1,998
Total benefits and expenses 9,044 8,823 8,896
Pretax operating earnings* $ 1,821 $ 1,652 $ 1,515
Weighted-average yen/dollar exchange rate 117.93 116.31 109.88
In Dollars In Yen
Percentage changes over previous year: 2007 2006 2005 2007 2006 2005
Premium income 3.1% .2% 4.5% 4.3% 5.9% 6.3%
Net investment income 6.7 3.2 5.0 8.0 9.0 7.0
Total operating revenues 3.7 .6 4.7 4.9 6.3 6.6
Pretax operating earnings* 10.2 9.1 9.9 11.8 15.4 11.5
*See Page 30 for our definition of segment operating earnings.
Aflac Japan Percentage
Changes Over Prior Year
(Yen Operating Results)
Including Foreign Excluding Foreign
Currency Changes *Currency Changes**
2007 2006 2005 2007 2006 2005
Net investment income 8.0% 9.0% 7.0% 7.4% 6.8% 6.3%
Total operating revenues 4.9 6.3 6.6 4.9 6.0 6.4
Pretax operating earnings* 11.8 15.4 11.5 11.3 13.3 10.8
*See Page 30 for our definition of segment operating earnings.
**Amounts excluding foreign currency changes on dollar-denominated items were determined using the same yen/dollar
**exchange rate for the current year as each respective prior year.
Ratios to total revenues in dollars: 2007 2006 2005
Benefits and claims 63.8% 65.4% 66.2%
Operating expenses:
Amortization of deferred policy acquisition costs 2.9 2.7 2.7
Insurance commissions 7.8 8.2 8.6
Insurance and other expenses 8.7 7.9 8.0
Total operating expenses 19.4 18.8 19.3
Pretax operating earnings* 16.8 15.8 14.5
*See Page 30 for our definition of segment operating earnings.