Aflac 2007 Annual Report Download - page 47
Download and view the complete annual report
Please find page 47 of the 2007 Aflac annual report below. You can navigate through the pages in the report by either clicking on the pages listed below, or by using the keyword search tool below to find specific information within the annual report.-
 1
1 -
2
-
3
-
4
-
5
-
6
-
7
-
8
-
9
-
10
-
11
-
12
-
13
-
14
-
15
-
16
-
17
-
18
-
19
-
20
-
21
-
22
-
23
-
24
-
25
-
26
-
27
-
28
-
29
-
30
-
31
-
32
-
33
-
34
-
35
-
36
-
 37
37 -
 38
38 -
 39
39 -
 40
40 -
 41
41 -
 42
42 -
 43
43 -
 44
44 -
 45
45 -
 46
46 -
 47
47 -
 48
48 -
 49
49 -
 50
50 -
 51
51 -
 52
52 -
 53
53 -
 54
54 -
 55
55 -
 56
56 -
 57
57 -
58
-
59
-
60
-
61
-
62
-
63
-
64
-
65
-
66
-
67
-
68
-
69
-
70
-
71
-
72
-
73
-
74
-
75
-
76
-
77
-
78
-
79
-
80
-
81
-
82
 |
 |

43
Annual Report for 2007
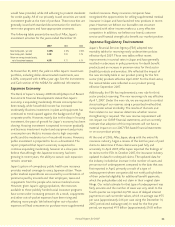
The distribution of payments for future policy benefits is an
estimate of all future benefit payments for policies in force as
of December 31, 2007. These projected values contain
assumptions for future policy persistency, mortality and
morbidity. The distribution of payments for unpaid policy
claims includes assumptions as to the timing of policyholders
reporting claims for prior periods and the amount of those
claims. Actual amounts and timing of both future policy
benefits and unpaid policy claims payments may differ
significantly from the estimates above. We anticipate that the
future policy benefit liability of $45.7 billion at December 31,
2007, along with future net premiums and investment income,
will be sufficient to fund future policy benefit payments.
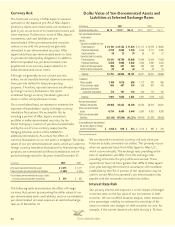
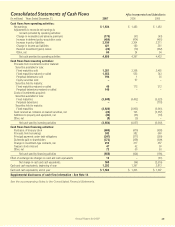
Consolidated Cash Flows
We translate cash flows for Aflac Japan’s yen-denominated
items into U.S. dollars using weighted-average exchange rates.
In years when the yen weakens, translating yen into dollars
causes fewer dollars to be reported. When the yen
strengthens, translating yen into dollars causes more dollars to
be reported. The following table summarizes consolidated
cash flows by activity for the years ended December 31.
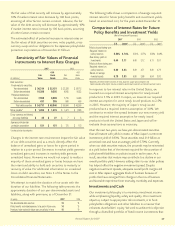
Operating Activities
The following table summarizes operating cash flows by
source for the years ended December 31.
We expect cash provided by operating activities in the future to
decline as a result of increased U.S. federal tax payments.
U.S. cash tax payments are expected to increase in
2008 because we fully utilized our remaining tax
credit carryforwards. Future cash provided by
operating activities will also be reduced by the payout
of lump-sum benefits to policyholders on a closed
block of business. The majority of these benefit
payouts will begin in 2008 and will conclude in 2012.
We anticipate paying out approximately $450 million
over the five-year period.
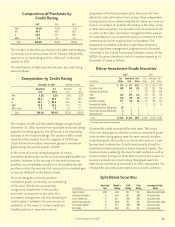
Investing Activities
Operating cash flow is primarily used to purchase debt
securities to meet future policy obligations. The following
table summarizes investing cash flows by source for the years
ended December 31.
Cash used by investing activities for Aflac U.S. and other
operations in 2005 included the January 2005 return of cash
collateral from the security lending activities of Aflac U.S. at
the end of 2004 (approximately $2.6 billion).
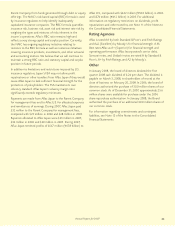
Prudent portfolio management dictates that we attempt to
match the duration of our assets with the duration of our
liabilities. Currently, when our debt securities mature, the
proceeds may be reinvested at a yield below that required for
the accretion of policy benefit liabilities on policies issued in
earlier years. However, the long-term nature of our business
and our strong cash flows provide us with the ability to
minimize the effect of mismatched durations and/or yields
identified by various asset adequacy analyses. When market
opportunities arise, we dispose of selected debt securities that
are available for sale to improve the duration matching of our
assets and liabilities, improve future investment yields, and/or
rebalance our portfolio. As a result, dispositions before
maturity can vary significantly from year to year. Dispositions
before maturity were approximately 4% of the annual average
investment portfolio of debt securities available for sale during
the year ended December 31, 2007, compared with 7% in
2006 and 11% in 2005. Dispositions before maturity in 2006
Distribution of Payments by Period
Total Total Less Than One to Four to After
(In millions) *Liability* Payments One Year Three Years Five Years Five Years
Future policy benefits liability $ 45,675 $ 229,269 $ 7,014 $ 13,949 $ 13,412 $ 194,894
Unpaid policy claims liability 2,455 2,455 1,866 363 128 98
Long-term debt – principal 1,457 1,457 – 800 569 88
Long-term debt – interest 5 72 22 29 14 7
Policyholder protection corporation 151 151 23 51 59 18
Operating service agreements N/A ** 606 96 178 149 183
Operating lease obligations N/A ** 145 46 35 21 43
Capitalized lease obligations 8 8 3 4 1 –
Total contractual obligations $ 49,751 $ 234,163 $ 9,070 $ 15,409 $ 14,353 $ 195,331
* Liability amounts are those reported on the consolidated balance sheet as of December 31, 2007.
** Not applicable
Liabilities for unrecognized tax benefits in the amount of $34 million have been excluded from the tabular disclosure above because the timing of
cash payment is not reasonably estimable.
Consolidated Cash Flows by Activity
(In millions) 2007 2006
2005
Operating activities $ 4,656 $ 4,397 $ 4,433
Investing activities (3,654) (4,057) (6,692)
Financing activities (655) (434) (196)
Exchange effect on cash and cash equivalents 13 – (61)
Net change in cash and cash equivalents $ 360 $ (94) $ (2,516)
Net Cash Provided by Operating Activities
(In millions)
2007 2006
2005
Aflac Japan $ 3,573 $ 3,437 $ 3,691
Aflac U.S. and other operations 1,083 960 742
Total $ 4,656 $ 4,397 $ 4,433
Net Cash Used by Investing Activities
(In millions)
2007 2006
2005
Aflac Japan $ (3,231) $ (3,372) $ (3,574)
Aflac U.S. and other operations (423) (685) (3,118)
Total $ (3,654) $ (4,057) $ (6,692)