Aflac 2007 Annual Report Download - page 37
Download and view the complete annual report
Please find page 37 of the 2007 Aflac annual report below. You can navigate through the pages in the report by either clicking on the pages listed below, or by using the keyword search tool below to find specific information within the annual report.-
 1
1 -
2
-
3
-
4
-
5
-
6
-
7
-
8
-
9
-
10
-
11
-
12
-
13
-
14
-
15
-
16
-
17
-
18
-
19
-
20
-
21
-
22
-
23
-
24
-
25
-
26
-
 27
27 -
 28
28 -
 29
29 -
 30
30 -
 31
31 -
 32
32 -
 33
33 -
 34
34 -
 35
35 -
 36
36 -
 37
37 -
 38
38 -
 39
39 -
 40
40 -
 41
41 -
 42
42 -
 43
43 -
 44
44 -
 45
45 -
 46
46 -
 47
47 -
48
-
49
-
50
-
51
-
52
-
53
-
54
-
55
-
56
-
57
-
58
-
59
-
60
-
61
-
62
-
63
-
64
-
65
-
66
-
67
-
68
-
69
-
70
-
71
-
72
-
73
-
74
-
75
-
76
-
77
-
78
-
79
-
80
-
81
-
82
 |
 |

would have provided, while still adhering to prudent standards
for credit quality. All of our privately issued securities are rated
investment grade at the time of purchase. These securities are
generally issued with standard documentation for medium-
term note programs and have appropriate covenants.
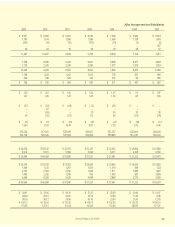
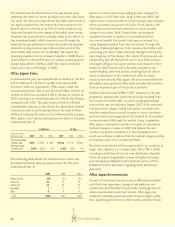
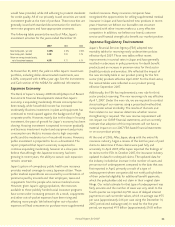
The following table presents the results of Aflac Japan’s
investment activities for the years ended December 31.
At December 31, 2007, the yield on Aflac Japan’s investment
portfolio, including dollar-denominated investments, was
4.02%, compared with 4.14% a year ago. See the Investments
and Cash section of this MD&A for additional information.
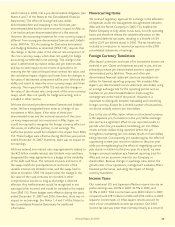
Japanese Economy
The Bank of Japan’s January 2008 Monthly Report of Recent
Economic & Financial Developments stated that Japan’s
economy is expanding moderately. Private consumption has
been steady, while household income has increased
moderately. Business investment in plant and equipment has
continued to trend upward against the background of high
corporate profits. However, mainly due to the drop in housing
investment, the pace of growth for Japan’s economy has been
slowing. Housing investment is expected to recover gradually,
and business investment in plant and equipment and private
consumption are likely to increase due to high corporate
profits and the moderate rise in household income. However,
public investment is projected to be on a downtrend. The
report projected that Japan’s economy is expected to
continue expanding moderately, however at a slow pace. We
believe that although the Japanese economy has been
growing in recent years, the ability to sustain such expansion
remains uncertain.
Japan’s system of compulsory public health care insurance
provides medical coverage to every Japanese citizen. These
public medical expenditures are covered by a combination of
premiums paid by insureds and their employers, taxes and
copayments from the people who receive medical service.
However, given Japan’s aging population, the resources
available to these publicly funded social insurance programs
have come under increasing pressure. As a result, copayments
and other out-of-pocket expenses have been rising and
affecting more people. We believe higher out-of-pocket
expenses will lead consumers to purchase more supplemental
medical insurance. Many insurance companies have
recognized the opportunities for selling supplemental medical
insurance in Japan and have launched new products in recent
years. However, we believe our favorable cost structure
compared with other insurers makes us a very effective
competitor. In addition, we believe our brand, customer
service and financial strength also benefit our market position.
Japanese Regulatory Environment
Japan’s Financial Services Agency (FSA) adopted new
mortality tables for reserving newly underwritten policies
effective April 2007. These new tables reflect recent
improvements in survival rates in Japan and have generally
resulted in a decrease in policy premiums for death benefit
products and an increase in premium rates for third sector
(health) products and annuities. We reflected the impact of
the new mortality table in our product pricing for the first
sector (life) products effective April 2007. For the third sector,
the revised tables were reflected in our product pricing
effective September 2007.
Additionally, the FSA has implemented a new rule for third
sector product reserving. The new reserving rule was effective
April 1, 2007. Under the new rule, we are required to conduct
stress testing of our reserves using a prescribed method that
incorporates actual morbidity. The results of the tests and
their relation to our reserves determine whether reserve
strengthening is required. This new reserve requirement will
not impact our GAAP financial statements, and we currently
estimate that adoption of this requirement will not have a
material impact on our 2007 FSA-based financial statements
or on our product pricing.
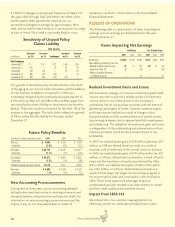
At the end of 2006, Aflac Japan, along with the entire life
insurance industry, began a review of the last five years of paid
claims to determine if those claims were paid fully and
accurately. In April 2007, Aflac Japan reported the findings of
its review to the FSA. In October 2007, the insurance industry
updated its data for underpaid claims. The updated data for
the industry included an increase in the number of cases and
yen amount of underpayment compared to the data that was
first reported in April, primarily a result of a type of
underpayment where companies did not notify policyholders
of their potential eligibility for additional benefit payments,
which the policyholders did not claim in their original claim
filings. Our initial estimate for that type of underpayment was
fairly accurate and the number of cases was very small. In the
fourth quarter we reported 26,700 cases of delayed interest
payments on cash surrender values, which on average was ¥75
per case (approximately $.66 per case using the December 31,
2007, period-end exchange rate). In total for the five-year
period, we reported ¥1.9 billion (approximately $16.8 million
33
Annual Report for 2007
2007 2006 2005
New money yield - yen only 3.05% 3.10% 2.95%
New money yield - blended 3.38 3.33 3.19
Return on average invested assets,
net of investment expenses 4.06 4.11 4.14