Aflac 2007 Annual Report Download - page 39
Download and view the complete annual report
Please find page 39 of the 2007 Aflac annual report below. You can navigate through the pages in the report by either clicking on the pages listed below, or by using the keyword search tool below to find specific information within the annual report.-
 1
1 -
2
-
3
-
4
-
5
-
6
-
7
-
8
-
9
-
10
-
11
-
12
-
13
-
14
-
15
-
16
-
17
-
18
-
19
-
20
-
21
-
22
-
23
-
24
-
25
-
26
-
27
-
28
-
 29
29 -
 30
30 -
 31
31 -
 32
32 -
 33
33 -
 34
34 -
 35
35 -
 36
36 -
 37
37 -
 38
38 -
 39
39 -
 40
40 -
 41
41 -
 42
42 -
 43
43 -
 44
44 -
 45
45 -
 46
46 -
 47
47 -
 48
48 -
 49
49 -
50
-
51
-
52
-
53
-
54
-
55
-
56
-
57
-
58
-
59
-
60
-
61
-
62
-
63
-
64
-
65
-
66
-
67
-
68
-
69
-
70
-
71
-
72
-
73
-
74
-
75
-
76
-
77
-
78
-
79
-
80
-
81
-
82
 |
 |

35
Annual Report for 2007
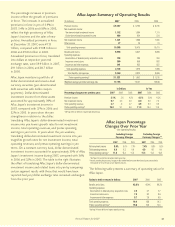
Aflac U.S. Sales
For 2007, total new annualized premium sales increased 9.5%,
which was at the upper end of our objective of 6% to 10%
growth for the year. An administrative change in the timing of
agents’ production credit for delay-bill policy conversions
accelerated approximately $8 million of conversion premiums
from the first quarter of 2008 to the fourth quarter of 2007.
Excluding the impact of the change in conversion processing,
total new annualized premium sales were up 8.9% for 2007.
The following table presents Aflac’s U.S. total new annualized
premium sales for the years ended December 31.
Our objective for 2008 is to increase total new annualized
premium sales by 8% to 12%.
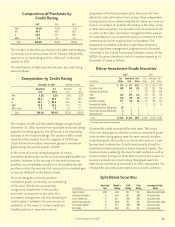
The following table details the contributions to total new
annualized premium sales by major product category for the
years ended December 31.
Total new annualized premium sales for accident/disability,
our leading product category, increased 7.1% in 2007, while
cancer expense insurance increased 11.1% and our hospital
indemnity category increased 19.9%, compared with 2006.
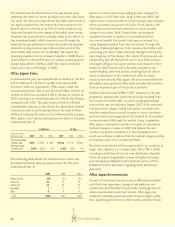
One aspect of our growth strategy is the continued
enhancement of our product line. In August 2007, Aflac U.S.
introduced a new cancer product, Maximum Difference. This
new cancer indemnity plan incorporates coverage for medical
advances in cancer prevention, diagnostics, treatment and the
many new ways cancer patients may now receive their care.
Maximum Difference allows customization of coverage to fit
varying needs and budgets.
Another aspect of our growth strategy is our focus on growing
and improving our U.S. sales force, and we were encouraged
to see continued expansion in 2007. We recruited more than
24,200 new sales associates in 2007, resulting in more than
71,200 licensed sales associates at December 31, 2007, a 4.2%
increase compared with 2006. Over the last two years, our
primary focus has been on increasing the number of average
weekly producers, which measures producers who make solid,
consistent contributions to sales. On a weekly basis, the
average number of U.S. associates actively producing business
rose 6.0% to more than 10,900 in 2007. Our focus on average
weekly producers as both a reporting and management metric
provides for a more active management of our sales associates
and allows our sales management to monitor progress and
needs on a real-time basis.
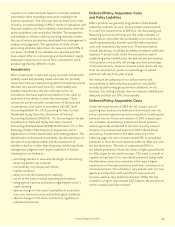
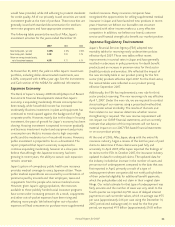
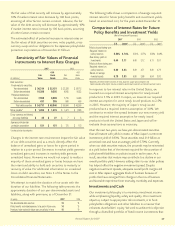
Aflac U.S. Investments
The following table presents the results of Aflac’s U.S.
investment activities.
At December 31, 2007, the portfolio yield on Aflac’s U.S.
portfolio was 7.00%, compared with 7.15% a year ago. See the
Investments and Cash section of this MD&A for additional
information.
OTHER OPERATIONS
Corporate operating expenses consist primarily of personnel
compensation, benefits and facilities expenses. Corporate
expenses, excluding investment income, were $56 million in
2007, $57 million in 2006, and $56 million in 2005.
Investment income included in reported corporate expenses
was $31 million in 2007, $16 million in 2006, and $14 million
in 2005.
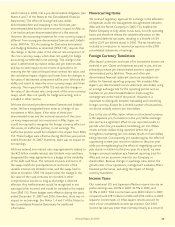
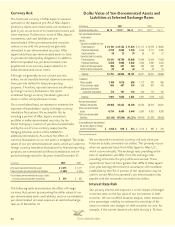
ANALYSIS OF FINANCIAL CONDITION
Our financial condition has remained strong in the functional
currencies of our operations during the last two years. The
yen/dollar exchange rate at the end of each period is used to
translate yen-denominated balance sheet items to U.S. dollars
for reporting purposes. The exchange rate at December 31,
2007, was ¥114.15 to one dollar, or 4.3% stronger than the
December 31, 2006, exchange rate of 119.11. The stronger yen
increased reported investments and cash by $1.9 billion, total
assets by $2.1 billion, and total liabilities by $2.1 billion,
compared with the amounts that would have been reported
for 2007 if the exchange rate had remained unchanged from
December 31, 2006.
Market Risks of Financial Instruments
Because we invest in fixed-income securities, our financial
instruments are exposed primarily to two types of market
risks: currency risk and interest rate risk.
(In millions) 2007 2006 2005
Total new annualized premium sales $ 1,558 $ 1,423 $ 1,259
Increase over prior year 9.5% 13.1% 6.1%
2007 2006 2005
Accident/disability coverage 51% 52% 51%
Cancer expense insurance 18 17 19
Hospital indemnity products 14 12 11
Fixed-benefit dental coverage 668
Other 11 13 11
Total 100% 100% 100%
2007 2006 2005
New money yield 6.44% 6.44% 6.16%
Return on average invested assets, net
of investment expenses 6.79 6.86 6.54