Aflac 2007 Annual Report Download - page 44
Download and view the complete annual report
Please find page 44 of the 2007 Aflac annual report below. You can navigate through the pages in the report by either clicking on the pages listed below, or by using the keyword search tool below to find specific information within the annual report.-
 1
1 -
2
-
3
-
4
-
5
-
6
-
7
-
8
-
9
-
10
-
11
-
12
-
13
-
14
-
15
-
16
-
17
-
18
-
19
-
20
-
21
-
22
-
23
-
24
-
25
-
26
-
27
-
28
-
29
-
30
-
31
-
32
-
33
-
 34
34 -
 35
35 -
 36
36 -
 37
37 -
 38
38 -
 39
39 -
 40
40 -
 41
41 -
 42
42 -
 43
43 -
 44
44 -
 45
45 -
 46
46 -
 47
47 -
 48
48 -
 49
49 -
 50
50 -
 51
51 -
 52
52 -
 53
53 -
 54
54 -
55
-
56
-
57
-
58
-
59
-
60
-
61
-
62
-
63
-
64
-
65
-
66
-
67
-
68
-
69
-
70
-
71
-
72
-
73
-
74
-
75
-
76
-
77
-
78
-
79
-
80
-
81
-
82
 |
 |

40 There’s Only One Aflac
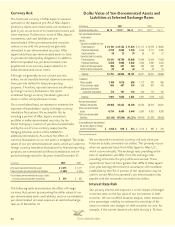
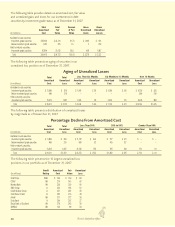
The following table provides details on amortized cost, fair value
and unrealized gains and losses for our investments in debt
securities by investment-grade status as of December 31, 2007.
The following table presents an aging of securities in an
unrealized loss position as of December 31, 2007.
The following table presents a distribution of unrealized losses
by magnitude as of December 31, 2007.
The following table presents the 10 largest unrealized loss
positions in our portfolio as of December 31, 2007.
Total Total Percent Gross Gross
Amortized Fair of Fair Unrealized Unrealized
(In millions) Cost Value Value Gains Losses
Available-for-sale securities:
Investment-grade securities $ 32,639 $ 33,791 61.7% $ 1,968 $ 816
Below-investment-grade securities 1,032 815 1.5 2 219
Held-to-maturity securities:
Investment-grade securities 20,804 20,125 36.8 408 1,087
Total $ 54,475 $ 54,731 100.0% $ 2,378 $ 2,122
Aging of Unrealized Losses
Total Total Less Than Six Months Six Months to 12 Months Over 12 Months
Amortized Unrealized Amortized Unrealized Amortized Unrealized Amortized Unrealized
(In millions) Cost Loss Cost Loss Cost Loss Cost Loss
Available-for-sale securities:
Investment-grade securities $ 11,899 $ 816 $ 1,060 $ 38 $ 4,080 $ 240 $ 6,759 $ 538
Below-investment-grade securities 999 219 – – – – 999 219
Held-to-maturity securities:
Investment-grade securities 13,613 1,087 1,583 58 3,624 161 8,406 868
Total $ 26,511 $ 2,122 $ 2,643 $ 96 $ 7,704 $ 401 $ 16,164 $1,625
Percentage Decline From Amortized Cost
Total Total Less Than 20% 20% to 50% Greater Than 50%
Amortized Unrealized Amortized Unrealized Amortized Unrealized Amortized Unrealized
(In millions) Cost Loss Cost Loss Cost Loss Cost Loss
Available-for-sale securities:
Investment-grade securities $ 11,899 $ 816 $ 11,172 $ 646 $ 727 $ 170 $ – $ –
Below-investment-grade securities 999 219 569 92 430 127 – –
Held-to-maturity securities:
Investment-grade securities 13,613 1,087 12,732 795 705 198 176 94
Total $ 26,511 $ 2,122 $ 24,473 $ 1,533 $ 1,862 $ 495 $ 176 $ 94
Credit Amortized Fair Unrealized
(In millions) Rating Cost Value Loss
SLM Corp. BBB $ 294 $ 150 $ 144
CSAV BB 210 143 67
Nordea Bank AA 350 290 60
KBC Group A 235 183 52
Credit Suisse Group A 531 482 49
Ford Motor Credit B 263 215 48
Ahold BB 311 272 39
Erste Bank A 394 357 37
Royal Bank of Scotland AA 279 243 36
BAWAG BB 123 90 33