Aflac 2007 Annual Report Download - page 26
Download and view the complete annual report
Please find page 26 of the 2007 Aflac annual report below. You can navigate through the pages in the report by either clicking on the pages listed below, or by using the keyword search tool below to find specific information within the annual report.-
 1
1 -
2
-
3
-
4
-
5
-
6
-
7
-
8
-
9
-
10
-
11
-
12
-
13
-
14
-
15
-
 16
16 -
 17
17 -
 18
18 -
 19
19 -
 20
20 -
 21
21 -
 22
22 -
 23
23 -
 24
24 -
 25
25 -
 26
26 -
 27
27 -
 28
28 -
 29
29 -
 30
30 -
 31
31 -
 32
32 -
 33
33 -
 34
34 -
 35
35 -
 36
36 -
37
-
38
-
39
-
40
-
41
-
42
-
43
-
44
-
45
-
46
-
47
-
48
-
49
-
50
-
51
-
52
-
53
-
54
-
55
-
56
-
57
-
58
-
59
-
60
-
61
-
62
-
63
-
64
-
65
-
66
-
67
-
68
-
69
-
70
-
71
-
72
-
73
-
74
-
75
-
76
-
77
-
78
-
79
-
80
-
81
-
82
 |
 |

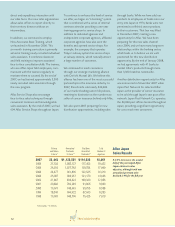
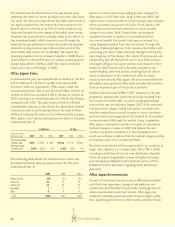
22 There’s Only One Aflac
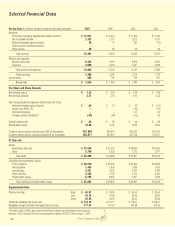
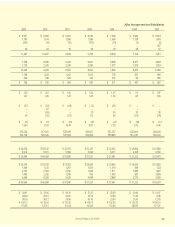
For the Year (In millions, except for share and per-share amounts) 2007 2006 2005 2004
Revenues:
Premiums, principally supplemental health insurance $ 12,973 $ 12,314 $ 11,990 $ 11,302
Net investment income 2,333 2,171 2,071 1,957
Realized investment gains (losses) 28 79 262 (12)
Gain on sale of broadcast business ––––
Other income 59 52 40 34
Total revenues 15,393 14,616 14,363 13,281
Benefits and expenses:
Benefits and claims 9,285 9,016 8,890 8,482
Expenses 3,609 3,336 3,247 3,026
Total benefits and expenses 12,894 12,352 12,137 11,508
Pretax earnings 2,499 2,264 2,226 1,773
Income taxes 865 781 743 507
Net earnings $ 1,634 $ 1,483 $ 1,483 $ 1,266
Per-Share and Share Amounts
Net earnings (basic) $ 3.35 $ 2.99 $ 2.96 $ 2.49
Net earnings (diluted) 3.31 2.95 2.92 2.45
Items impacting net earnings per diluted share, net of tax:
Realized investment gains (losses) $ .04 $ .10 $ .33 $ (.01)
Impact from SFAS 133 –– (.02) (.03)
Nonrecurring items ––.07.26
Foreign currency translation* (.02) (.08) (.02) .08
Cash dividends paid $ .80 $ .55 $ .44 $ .38
Shareholders’ equity 18.08 16.93 15.89 15.04
Common shares used to calculate basic EPS (In thousands) 487,869 495,614 500,939 507,333
Common shares used to calculate diluted EPS (In thousands) 493,971 501,827 507,704 516,421
At Year-end
Assets:
Investments and cash $ 57,056 $ 51,972 $ 48,989 $ 51,955
Other 8,749 7,833 7,372 7,371
Total assets $ 65,805 $ 59,805 $ 56,361 $ 59,326
Liabilities and shareholders’ equity:
Policy liabilities $ 50,676 $ 45,440 $ 42,329 $ 43,556
Notes payable 1,465 1,426 1,395 1,429
Income taxes 2,531 2,462 2,577 2,445
Other liabilities 2,338 2,136 2,133 4,320
Shareholders’ equity 8,795 8,341 7,927 7,576
Total liabilities and shareholders’ equity $ 65,805 $ 59,805 $ 56,361 $ 59,326
Supplemental Data
Stock price range: High $ 63.91 $ 49.40 $ 49.65 $ 42.60
Low 45.18 41.63 35.50 33.85
Close 62.63 46.00 46.42 39.84
Yen/dollar exchange rate at year-end ¥ 114.15 ¥ 119.11 ¥ 118.07 ¥ 104.21
Weighted-average yen/dollar exchange rate for the year 117.93 116.31 109.88 108.26
*Translation effect on Aflac Japan segment and Parent Company yen-denominated interest expense
Amounts in 2001 through 2004 have been adjusted for adoption of SFAS 123R on January 1, 2005.
Selected Financial Data