Advance Auto Parts 2003 Annual Report Download - page 47
Download and view the complete annual report
Please find page 47 of the 2003 Advance Auto Parts annual report below. You can navigate through the pages in the report by either clicking on the pages listed below, or by using the keyword search tool below to find specific information within the annual report.-
 1
1 -
2
-
3
-
4
-
5
-
6
-
7
-
8
-
9
-
10
-
11
-
12
-
13
-
14
-
15
-
16
-
17
-
18
-
19
-
20
-
21
-
22
-
23
-
24
-
25
-
26
-
27
-
28
-
29
-
30
-
31
-
32
-
33
-
34
-
35
-
36
-
 37
37 -
 38
38 -
 39
39 -
 40
40 -
 41
41 -
 42
42 -
 43
43 -
 44
44 -
 45
45 -
 46
46 -
 47
47 -
 48
48 -
 49
49 -
 50
50 -
 51
51 -
 52
52
 |
 |

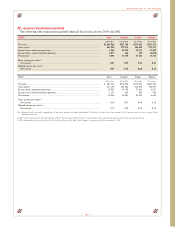
22—Quarterly Financial Data (unaudited)
The following table summarizes quarterly financial data for fiscal years 2003 and 2002:
2003(1) First Second Third Fourth
(16 weeks) (12 weeks) (12 weeks) (13 weeks)
Net sales ................................................................................................................................ $1,005,968 $827,348 $839,101 $821,279
Gross profit............................................................................................................................ 463,989 379,474 386,928 374,127
Income from continuing operations...................................................................................... 3,968 43,292 44,745 33,282
Income (loss) on discontinued operations............................................................................. 1,073 166 419 (2,010)
Net income ............................................................................................................................ 5,041 43,458 45,164 31,272
Basic income per share(2):
Net income ........................................................................................................................ 0.07 0.59 0.61 0.42
Diluted income per share(2):
Net income ........................................................................................................................ 0.07 0.58 0.60 0.41
2002(1) First Second Third Fourth
(16 weeks) (12 weeks) (12 weeks) (12 weeks)
Net sales ................................................................................................................................ $ 967,316 $774,906 $772,723 $689,195
Gross profit............................................................................................................................ 431,198 345,802 346,840 310,567
Income from continuing operations...................................................................................... 10,725 15,339 27,861 8,223
Income (loss) on discontinued operations............................................................................. 1,371 602 502 396
Net income ............................................................................................................................ 12,096 15,941 28,363 8,619
Basic income per share(2):
Net income ........................................................................................................................ 0.18 0.23 0.40 0.12
Diluted income per share(2):
Net income ........................................................................................................................ 0.17 0.22 0.39 0.12
Note: Quarterly and year-to-date computations of per share amounts are made independently. Therefore, the sum of per share amounts for the quarters may not agree with per share
amounts for the year.
(1) The results of operations for the four quarters of fiscal 2003 and fiscal 2002 reflect the reclassification of the wholesale operating results as discontinued operations.
(2) The earnings per share results reflect the effect of a two-for-one stock split of the Company’s common stock effective January 2, 2004.
Page 45
Advance Auto Parts, Inc. and Subsidiaries