Advance Auto Parts 2003 Annual Report Download - page 14
Download and view the complete annual report
Please find page 14 of the 2003 Advance Auto Parts annual report below. You can navigate through the pages in the report by either clicking on the pages listed below, or by using the keyword search tool below to find specific information within the annual report.-
 1
1 -
2
-
3
-
 4
4 -
 5
5 -
 6
6 -
 7
7 -
 8
8 -
 9
9 -
 10
10 -
 11
11 -
 12
12 -
 13
13 -
 14
14 -
 15
15 -
 16
16 -
 17
17 -
 18
18 -
 19
19 -
 20
20 -
 21
21 -
 22
22 -
 23
23 -
 24
24 -
25
-
26
-
27
-
28
-
29
-
30
-
31
-
32
-
33
-
34
-
35
-
36
-
37
-
38
-
39
-
40
-
41
-
42
-
43
-
44
-
45
-
46
-
47
-
48
-
49
-
50
-
51
-
52
 |
 |

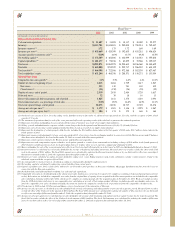
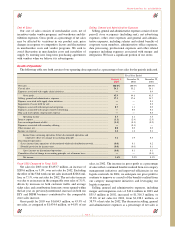
Additionally, we evaluate the quality of our results based on growth in certain key financial metrics. These key indicators
consist primarily of:
For Year For Year For Year
Key Financial Statistics Ended 2003(1) Ended 2002 Ended 2001
Comparable store sales growth............................................................................................................ 3.1% 5.5% 6.2%
DIY comparable stores sales growth................................................................................................... 2.4% 5.6% 5.4%
DIFM comparable stores sales growth................................................................................................ 7.2% 5.0% 10.0%
Average net sales per store (in thousands) .......................................................................................... $ 1,379 $ 1,303 $ 1,346
Inventory per store (in thousands)....................................................................................................... $438,669 $429,399 $392,635
Inventory turnover................................................................................................................................ 1.72 1.75 1.72
Gross margins...................................................................................................................................... 45.9% 44.8% 43.5%
Operating margins ............................................................................................................................... 8.3% 6.1% 3.5%
Note: These metrics should be reviewed along with the Selected Financial Data elsewhere in this Annual Report, which includes descriptions regarding the calculation of these measures.
(1) All financial metrics include the 53rd week, except the average net sales per store metric.
The following discussion and analysis of financial condi-
tion and results of operations should be read in conjunction
with “Selected Financial Data,” our consolidated historical
financial statements and the notes to those statements that
appear elsewhere in this report. Our discussion contains
forward-looking statements based upon current expecta-
tions that involve risks and uncertainties, such as our plans,
objectives, expectations and intentions. Actual results and
the timing of events could differ materially from those antic-
ipated in these forward-looking statements as a result of a
number of factors, including those set forth under “Forward-
Looking Statements” elsewhere in this report and “Risk
Factors” found in our Form 10-K filed on March 12, 2004
with the Securities and Exchange Commission.
Our fiscal year ends on the Saturday nearest December 31
of each year. Our first quarter consists of 16 weeks, and the
other three quarters consist of 12 weeks, with the exception
of the fourth quarter fiscal 2003 which contained 13 weeks
due to our 53-week fiscal year in 2003.
Introduction
In 2003, we produced strong operating results and built
momentum to carry us into what we believe will be another
successful year in 2004. Our 2003 performance and our posi-
tive outlook for 2004, is primarily a result of our management
team’s focus to drive top-line sales growth and increase our
operating margins through our category management initia-
tives, our national advertising campaign and leveraging our
logistics and operating expenses. The category management
initiative not only drives top-line sales by developing
improved product assortments by category but also focusing on
maximizing gross profit within each product category offered.
For 2003, we grew our total sales by 9.0% over last year to
$3.5 billion, including the 53rd week. We also improved our
operating margins to 8.3% of total sales, including the 53rd
week, an increase of 46.8% over 2002. In addition to the
above initiatives, our operating margins benefited from
leveraging our selling, general and administrative expenses.
MANAGEMENT’S DISCUSSION AND ANALYSIS OF FINANCIAL CONDITION AND RESULTS OF OPERATIONS
Page 12
Overview
We primarily operate within the United States automotive
aftermarket industry, which includes replacement parts
(excluding tires), accessories, maintenance items, batteries
and automotive chemicals for cars and light trucks (pickup
trucks, vans, minivans and sport utility vehicles). We currently
are the second largest specialty retailer of automotive parts,
accessories and maintenance items to “do-it-yourself,” or
DIY, customers in the United States, based on store count
and sales. Our combined operations are now conducted in our
retail operating segment subsequent to the discontinuation of
the wholesale distribution network in 2003.
We were formed in 1929 and operated as a retailer of
general merchandise until the 1980s. During the 1980s, we
sharpened our focus to target sales of automotive parts and
accessories to DIY customers. From the 1980s to the present,
we have grown significantly as a result of strong compara-
ble store sales growth, new store openings and strategic
acquisitions, including our 1998 Western Auto Supply
Company acquisition and our 2001 acquisition of Discount
Auto Parts, or Discount. Additionally, in 1996, we began to
aggressively expand our sales to “do-it-for-me,” or DIFM,
customers by implementing a commercial delivery program.
At January 3, 2004, we operated 2,539 stores within the
United States, Puerto Rico and the Virgin Islands. We operated
2,503 stores throughout 39 states in the Northeastern, South-
eastern and Midwestern regions of the United States. These
stores operated primarily under the “Advance Auto Parts” trade
name except for the state of Florida, which operated under
“Advance Discount Auto Parts” or “Discount Auto Parts” trade