Advance Auto Parts 2003 Annual Report Download - page 3
Download and view the complete annual report
Please find page 3 of the 2003 Advance Auto Parts annual report below. You can navigate through the pages in the report by either clicking on the pages listed below, or by using the keyword search tool below to find specific information within the annual report.-
 1
1 -
 2
2 -
 3
3 -
 4
4 -
 5
5 -
 6
6 -
 7
7 -
 8
8 -
 9
9 -
 10
10 -
 11
11 -
 12
12 -
 13
13 -
 14
14 -
15
-
16
-
17
-
18
-
19
-
20
-
21
-
22
-
23
-
24
-
25
-
26
-
27
-
28
-
29
-
30
-
31
-
32
-
33
-
34
-
35
-
36
-
37
-
38
-
39
-
40
-
41
-
42
-
43
-
44
-
45
-
46
-
47
-
48
-
49
-
50
-
51
-
52
 |
 |

Page 1
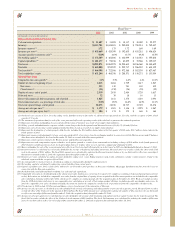
5-Year
Compounded Fiscal Year (1)
Growth 2003 2002 2001 2000 1999
(in thousands, except per share data)
Statement of Operations Data:
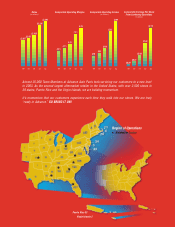
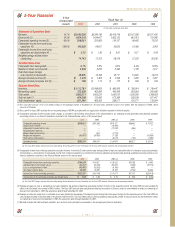
Net sales...................................................... 14.7% $3,493,696 $3,204,140 $2,419,746 $2,167,308 $2,017,425
Gross profit (2)............................................ 19.3% 1,604,518 1,434,407 1,062,152 881,013 791,985
Comparable operating income (3)............... 43.6% 298,651 231,883 119,127 88,462 70,232
Comparable income from continuing
operations (4).......................................... 138.0% 160,529 94,267 35,652 15,188 5,002
Comparable income from continuing
operations per diluted share (4) .............. $ 2.15 $ 1.30 $ 0.61 $ 0.27 $ 0.09
Weighted average diluted shares
outstanding.............................................. 74,743 72,376 58,316 57,222 56,538
Selected Store Data:
Comparable store sales growth ................... 3.1% 5.5% 6.2% 4.4% 10.3%
Number of stores, end of period.................. 2,539 2,435 2,484 1,729 1,617
Total store square footage,
end of period (in thousands) ................... 18,875 18,108 18,717 13,325 12,476
Average net sales per store (5) .................... $ 1,379 $ 1,303 $ 1,346 $ 1,295 $ 1,267
Average net sales per square foot (6) .......... $ 186 $ 174 $ 175 $ 168 $ 164
Balance Sheet Data:
Inventory...................................................... $1,113,781 $1,048,803 $ 982,000 $ 788,914 $ 749,447
Net working capital...................................... 372,509 462,896 442,099 318,583 355,608
Total assets.................................................. 1,983,071 1,965,225 1,950,615 1,356,360 1,348,629
Total net debt (7) ......................................... 464,598 722,506 972,368 582,539 627,467
Total stockholders’ equity ............................ 631,244 468,356 288,571 156,271 133,954
(1) Our fiscal year consists of 52 or 53 weeks ending on the Saturday nearest to December 31. All fiscal years presented consist of 52 weeks, with the exception of 2003, which
consists of 53 weeks.
(2) Gross profit for fiscal 2001 excludes the non-recurring charge of $9,099 associated with our supply chain initiatives recorded in the fourth quarter.
(3) Comparable operating income excludes certain charges as included in the following reconciliation of this measurement to our operating income presented under generally accepted
accounting policies in our financial statements contained in the Financial Review section of this annual report.
2003 2002 2001 (a) 2000 1999
Comparable operating income .......................................................... $298,651 $231,883 $119,127 $88,462 $ 70,232
Supply chain initiatives..................................................................... —— (10,492) — —
Impairment of assets held for sale .................................................... —— (10,700) (856) —
Recapitalization expenses.................................................................. —————
Merger related restructuring.............................................................. —(597) (3,719) — —
Merger and integration...................................................................... (10,417) (34,935) (1,135) — (41,034)
Stock option compensation............................................................... —— (8,611) (729) (1,082)
Operating income.............................................................................. $288,234 $196,351 $ 84,470 $86,877 $ 28,116
(a) The fiscal 2001 charges represent only those taken during the fourth quarter. For more information see the fiscal 2001 financial statements and accompanying footnotes.
(4) Comparable income from continuing operations excludes the items in footnote (3) above and the early extinguishment of debt and cumulative effect of a change in accounting principle.
The following is a reconciliation of comparable income from continuing operations to income from continuing operations presented under generally accepted accounting policies in our
financial statements contained in the Financial Review section of this annual report.
2003 2002 2001 (a) 2000 1999
Comparable income from continuing operations .............................. $160,529 $ 94,267 $ 35,652 $15,188 $ 5,002
Add back items from footnote (3) (a) ................................................ (10,417) (35,532) (34,657) (1,585) (42,116)
Loss on extinguishment of debt........................................................ (46,887) (16,822) (6,106) 4,692 —
Tax impact of above items................................................................. 22,062 20,235 16,182 (1,144) 16,636
Income (loss) from continuing operations ........................................ $125,287 $ 62,148 $ 11,071 $17,151 $(20,478)
Income (loss) from continuing operations per diluted share............. $ 1.68 $ 0.86 $ 0.19 $ 0.30 $ (0.36)
(a) The fiscal 2001 charges represent only those taken during the fourth quarter. For more information see the fiscal 2001 financial statements and accompanying footnotes.
(5) Average net sales per store is calculated as net sales divided by the average of beginning and ending number of stores for the respective period. The fiscal 2003 net sales exclude the
effect of the 53rd week in the amount of $63.0 million. The fiscal 2001 amounts were calculated by reducing the number of Discount stores by one-thirteenth to reflect our ownership of
Discount from December 2, 2001 (the acquisition date) through December 29, 2001.
(6) Average net sales per square foot is calculated as net sales divided by the average of the beginning and ending total store square footage for the respective period. The fiscal 2003 net
sales exclude the effect of the 53rd week in the amount of $63.0 million. The fiscal 2001 amounts were calculated by reducing the number of Discount stores by one-thirteenth to reflect
our ownership of Discount from December 2, 2001 (the acquisition date) through December 29, 2001.
(7) Net debt includes total debt and bank overdrafts, less cash and cash equivalents as presented on the accompanying financial statements.
5-Year Financial
Advance Auto Parts, Inc. and Subsidiaries