Advance Auto Parts 2003 Annual Report Download - page 12
Download and view the complete annual report
Please find page 12 of the 2003 Advance Auto Parts annual report below. You can navigate through the pages in the report by either clicking on the pages listed below, or by using the keyword search tool below to find specific information within the annual report.-
 1
1 -
 2
2 -
 3
3 -
 4
4 -
 5
5 -
 6
6 -
 7
7 -
 8
8 -
 9
9 -
 10
10 -
 11
11 -
 12
12 -
 13
13 -
 14
14 -
 15
15 -
 16
16 -
 17
17 -
 18
18 -
 19
19 -
 20
20 -
 21
21 -
 22
22 -
23
-
24
-
25
-
26
-
27
-
28
-
29
-
30
-
31
-
32
-
33
-
34
-
35
-
36
-
37
-
38
-
39
-
40
-
41
-
42
-
43
-
44
-
45
-
46
-
47
-
48
-
49
-
50
-
51
-
52
 |
 |
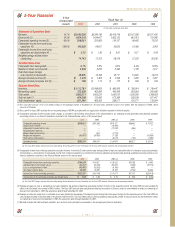
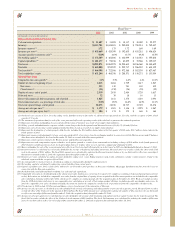
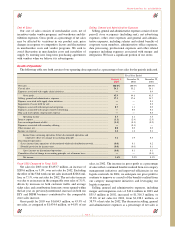
The following table sets forth our selected historical consolidated statement of operations, balance sheet and other operating
data. The selected historical consolidated financial and other data at January 3, 2004 and December 28, 2002 and for the
three years ended January 3, 2004 have been derived from our audited consolidated financial statements and the related notes
included elsewhere in this report. The historical consolidated financial and other data at December 29, 2001, December 30,
2000 and January 1, 2000 and for the years ended December 30, 2000 and January 1, 2000 have been derived from our
audited consolidated financial statements and the related notes that have not been included in this report. You should read
this data along with “Management’s Discussion and Analysis of Financial Condition and Results of Operations,” and the
consolidated financial statements and the related notes of Advance included elsewhere in this report.
Fiscal Year(1)(2)
2003 2002 2001 2000 1999
(in thousands, except per share data)
Statement of Operations Data:
Net sales
...............................................................................................................
$3,493,696 $3,204,140 $2,419,746 $2,167,308 $2,017,425
Cost of sales
..........................................................................................................
1,889,178 1,769,733 1,357,594 1,286,295 1,225,440
Supply chain initiatives(3)
........................................................................................
—— 9,099 — —
Gross profit
...........................................................................................................
1,604,518 1,434,407 1,053,053 881,013 791,985
Selling, general and administrative expenses(4)
..........................................................
1,305,867 1,202,524 938,300 792,551 721,753
Expenses associated with supply chain initiatives(5)
...................................................
—— 1,394 — —
Impairment of assets held for sale(6)
.........................................................................
—— 12,300 856 —
Expenses associated with the merger related restructuring(7)
......................................
—597 3,719 — —
Expenses associated with merger and integration(8)
...................................................
10,417 34,935 1,135 — 41,034
Non-cash stock option compensation expense(9)
........................................................
—— 11,735 729 1,082
Operating income
...................................................................................................
288,234 196,351 84,470 86,877 28,116
Interest expense
.....................................................................................................
(37,576) (77,081) (61,042) (64,212) (62,792)
(Loss) gain on extinguishment of debt
.....................................................................
(47,288) (16,822) (6,106) 4,692 —
Expenses associated with secondary offering
............................................................
—(1,733) — — —
Other income, net
..................................................................................................
341 963 1,033 581 4,649
Income (loss) from continuing operations before income taxes, loss (income) on
discontinued operations and cumulative effect of a change in accounting principle
.....
203,711 101,678 18,355 27,938 (30,027)
Income tax expense (benefit)
...................................................................................
78,424 39,530 7,284 10,787 (9,549)
Income (loss) from continuing operations before (loss) income on discontinued
operations and cumulative effect of a change in accounting principle
......................
125,287 62,148 11,071 17,151 (20,478)
Discontinued operations:
(Loss) income from operations of discontinued Wholesale Distribution Network
(including loss on disposal of $2,693)
...............................................................
(572) 4,691 4,040 3,915 (7,883)
(Benefit) provision for income taxes
......................................................................
(220) 1,820 1,604 1,507 (3,035)
(Loss) income on discontinued operations
................................................................
(352) 2,871 2,436 2,408 (4,848)
Cumulative effect of a change in accounting principle, net of $1,360 income taxes
......
—— (2,065) — —
Net income (loss)
...................................................................................................
$ 124,935 $ 65,019 $ 11,442 $ 19,559 $ (25,326)
Income (loss) from continuing operations before (loss) income on
discontinued operations and cumulative effect of a change in
accounting principle per basic share
.....................................................................
$ 1.72 $ 0.89 $ 0.19 $ 0.30 $ (0.36)
Income (loss) from continuing operations before (loss) income on
discontinued operations and cumulative effect of a change in
accounting principle per diluted share
..................................................................
$ 1.68 $ 0.86 $ 0.19 $ 0.30 $ (0.36)
Net income (loss) per basic share
............................................................................
$ 1.71 $ 0.93 $ 0.20 $ 0.35 $ (0.45)
Net income (loss) per diluted share
..........................................................................
$ 1.67 $ 0.90 $ 0.20 $ 0.34 $ (0.45)
Weighted-average basic shares outstanding(10)
...........................................................
72,999 70,098 57,274 56,592 56,538
Weighted-average diluted shares outstanding(10)
........................................................
74,743 72,376 58,316 57,222 56,538
Cash Flows Provided By (Used In):
Operating activities
................................................................................................
$ 355,921 $ 242,996 $ 103,536 $ 103,951 $ (20,976)
Investing activities
.................................................................................................
(85,474) (78,005) (451,008) (64,940) (113,824)
Financing activities
................................................................................................
(272,845) (169,223) 347,580 (43,579) 121,262
(continued)
SELECTED FINANCIAL DATA
Page 10