Advance Auto Parts 2003 Annual Report Download - page 17
Download and view the complete annual report
Please find page 17 of the 2003 Advance Auto Parts annual report below. You can navigate through the pages in the report by either clicking on the pages listed below, or by using the keyword search tool below to find specific information within the annual report.-
 1
1 -
2
-
3
-
4
-
5
-
6
-
 7
7 -
 8
8 -
 9
9 -
 10
10 -
 11
11 -
 12
12 -
 13
13 -
 14
14 -
 15
15 -
 16
16 -
 17
17 -
 18
18 -
 19
19 -
 20
20 -
 21
21 -
 22
22 -
 23
23 -
 24
24 -
 25
25 -
 26
26 -
 27
27 -
28
-
29
-
30
-
31
-
32
-
33
-
34
-
35
-
36
-
37
-
38
-
39
-
40
-
41
-
42
-
43
-
44
-
45
-
46
-
47
-
48
-
49
-
50
-
51
-
52
 |
 |

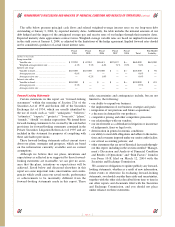
Results of Operations
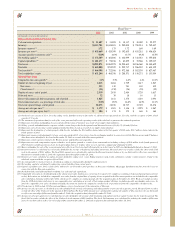
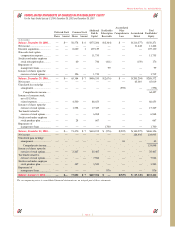
The following table sets forth certain of our operating data expressed as a percentage of net sales for the periods indicated.
Fiscal Year Ended
January 3, December 28, December 29,
2004 2002 2001
Net sales ............................................................................................................................................. 100.0% 100.0% 100.0%
Cost of sales ....................................................................................................................................... 54.1 55.2 56.1
Expenses associated with supply chain initiatives............................................................................. —— 0.4
Gross profit................................................................................................................................. 45.9 44.8 43.5
Selling, general and administrative expenses..................................................................................... 37.3 37.6 38.7
Expense associated with supply chain initiatives .............................................................................. —— 0.1
Impairment of assets held for sale ..................................................................................................... —— 0.5
Expenses associated with merger and integration.............................................................................. 0.3 1.1 0.0
Expenses associated with merger related restructuring ..................................................................... —0.0 0.2
Non-cash stock option compensation expense................................................................................... —— 0.5
Operating income....................................................................................................................... 8.3 6.1 3.5
Interest expense.................................................................................................................................. (1.1) (2.4) (2.5)
Loss on extinguishment of debt......................................................................................................... (1.4) (0.5) (0.2)
Expenses associated with secondary offering.................................................................................... —(0.1) —
Other income, net............................................................................................................................... 0.0 0.0 0.0
Income tax expense............................................................................................................................ 2.2 1.2 0.3
Income from continuing operations before discontinued operations and
cumulative effect of a change in accounting principle .......................................................... 3.6 1.9 0.5
Discontinued operations:
(Loss) income from operations of discontinued wholesale distribution network.......................... (0.0) 0.1 0.2
(Benefit) provision for income taxes.............................................................................................. (0.0) (0.0) 0.1
(Loss) income on discontinued operations................................................................................. (0.0) 0.1 0.1
Cumulative effect of change in accounting principle, net of income taxes....................................... —— (0.1)
Net income ................................................................................................................................. 3.6% 2.0% 0.5%
Cost of Sales
Our cost of sales consists of merchandise costs, net of
incentives under vendor programs, and warehouse and dis-
tribution expenses. Gross profit as a percentage of net sales
may be affected by variations in our product mix, price
changes in response to competitive factors and fluctuations
in merchandise costs and vendor programs. We seek to
avoid fluctuation in merchandise costs and instability of
supply by entering into long-term purchasing agreements
with vendors when we believe it is advantageous.
Selling, General and Administrative Expenses
Selling, general and administrative expenses consist of store
payroll, store occupancy (including rent), net advertising
expenses, other store expenses and general and adminis-
trative expenses, including salaries and related benefits of
corporate team members, administrative office expenses,
data processing, professional expenses and other related
expenses including expenses associated with merger and
integration. We lease a significant portion of our stores.
Page 15
Advance Auto Parts, Inc. and Subsidiaries
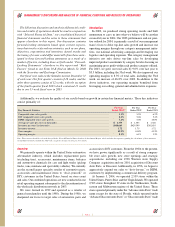
Fiscal 2003 Compared to Fiscal 2002
Net sales for 2003 were $3,493.7 million, an increase of
$289.6 million, or 9.0%, over net sales for 2002. Excluding
the effect of the 53rd week our net sales increased $226.6 mil-
lion, or 7.1%, over net sales for 2002. The net sales increase
was due to an increase in the comparable store sales of 3.1%,
driven by increases in both customer traffic and average
ticket sales, and contributions from new stores opened within
the last year. As previously mentioned, increases in both our
DIY and DIFM business contributed to the comparable
store sales increase.
Gross profit for 2003 was $1,604.5 million, or 45.9% of
net sales, as compared to $1,434.4 million, or 44.8% of net
sales, in 2002. The increase in gross profit as a percentage
of sales reflects continued benefits realized from our category
management initiatives and improved efficiencies in our
logistics network. In 2004, we anticipate our gross profit to
continue to improve as a result of the benefits realized from
our category management initiatives and leveraging our
logistics expenses.
Selling, general and administrative expenses, including
merger and integration costs of $10.4 million in 2003 and
$35.5 million in 2002, increased to $1,316.3 million, or
37.6% of net sales for 2003, from $1,238.1 million, or
38.7% of net sales for 2002. The decrease in selling, general
and administrative expenses as a percentage of net sales is