Advance Auto Parts 2003 Annual Report Download - page 13
Download and view the complete annual report
Please find page 13 of the 2003 Advance Auto Parts annual report below. You can navigate through the pages in the report by either clicking on the pages listed below, or by using the keyword search tool below to find specific information within the annual report.-
 1
1 -
2
-
 3
3 -
 4
4 -
 5
5 -
 6
6 -
 7
7 -
 8
8 -
 9
9 -
 10
10 -
 11
11 -
 12
12 -
 13
13 -
 14
14 -
 15
15 -
 16
16 -
 17
17 -
 18
18 -
 19
19 -
 20
20 -
 21
21 -
 22
22 -
 23
23 -
24
-
25
-
26
-
27
-
28
-
29
-
30
-
31
-
32
-
33
-
34
-
35
-
36
-
37
-
38
-
39
-
40
-
41
-
42
-
43
-
44
-
45
-
46
-
47
-
48
-
49
-
50
-
51
-
52
 |
 |

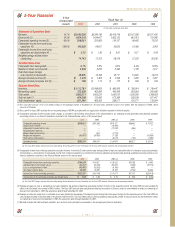
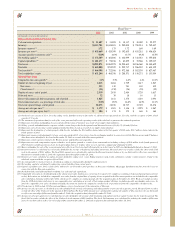
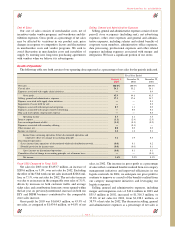
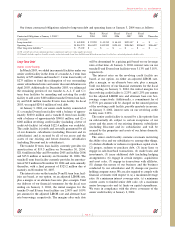
Fiscal Year(1)(2)
2003 2002 2001 2000 1999
(in thousands, except store data and ratios)
Balance Sheet and Other Financial Data:
Cash and cash equivalents
..............................................................................
$ 11,487 $ 13,885 $ 18,117 $ 18,009 $ 22,577
Inventory
......................................................................................................
$1,113,781 $1,048,803 $ 982,000 $ 788,914 $ 749,447
Inventory turnover(11)
.....................................................................................
1.72 1.75 1.72 1.69 1.69
Inventory per store(12)
.....................................................................................
$ 438,669 $ 429,399 $ 392,635 $ 451,281 $ 456,624
Accounts payable to inventory ratio(13)
............................................................
51.0% 44.9% 43.7% 49.2% 45.5%
Net working capital(14)
...................................................................................
$ 372,509 $ 462,896 $ 442,099 $ 318,583 $ 355,608
Capital expenditures(15)
..................................................................................
$ 101,177 $ 98,186 $ 63,695 $ 70,566 $ 105,017
Total assets
...................................................................................................
$1,983,071 $1,965,225 $1,950,615 $1,356,360 $1,348,629
Total debt
.....................................................................................................
$ 445,000 $735,522 $ 955,737 $ 586,949 $ 638,329
Total net debt(16)
............................................................................................
$ 464,598 $ 722,506 $ 972,368 $ 582,539 $ 627,467
Total stockholders’ equity
..............................................................................
$ 631,244 $ 468,356 $ 288,571 $ 156,271 $ 133,954
Selected Store Data:
Comparable store sales growth(17)
....................................................................
3.1% 5.5% 6.2% 4.4% 10.3%
Number of stores at beginning of year
............................................................
2,435 2,484 1,729 1,617 1,567
New stores
................................................................................................
125 110 781 140 102
Closed stores(18)
.........................................................................................
(21) (159) (26) (28) (52)
Number of stores, end of period
.....................................................................
2,539 2,435 2,484 1,729 1,617
Relocated stores
............................................................................................
32 39 18 10 13
Stores with commercial delivery program, end of period
..................................
1,625 1,411 1,370 1,210 1,094
Total commercial sales, as a percentage of total sales
.......................................
15.8% 15.0% 16.8% 16.5% 12.1%
Total store square footage, end of period
.........................................................
18,875 18,108 18,717 13,325 12,476
Average net sales per store(19)
.........................................................................
$ 1,379 $ 1,303 $ 1,346 $ 1,295 $ 1,267
Average net sales per square foot(20)
................................................................
$ 186 $ 174 $ 175 $ 168 $ 164
(1) Our fiscal year consists of 52 or 53 weeks ending on the Saturday nearest to December 31. All fiscal years presented are 52 weeks, with the exception of 2003, which
consists of 53 weeks.
(2) The statement of operations data for each of the years presented reflects the operating results of the wholesale segment as discontinued operations.
(3) Represents restocking and handling fees associated with the return of inventory as a result of our supply chain initiatives.
(4) Selling, general and administrative expenses exclude certain charges disclosed separately and discussed in notes (5), (6), (7), (8) and (9) below.
(5) Represents costs of relocating certain equipment held at facilities closed as a result of our supply chain initiatives.
(6) Represents the devaluation of certain property held for sale, including the $1.6 million charge taken in the first quarter of 2001 and a $10.7 million charge taken in the
fourth quarter of 2001.
(7) Represents expenses related primarily to lease costs associated with 31 of our stores closed in overlapping markets in connection with the Western merger and 27 Advance
Auto Parts stores identified to be closed at December 29, 2001 as a result of the Discount acquisition.
(8) Represents certain expenses related to the Western merger and the Discount acquisition.
(9) Represents non-cash compensation expense related to stock options granted to certain of our team members, including a charge of $8.6 million in the fourth quarter of
2001 related to variable provisions of our stock option plans that were in place when we were a private company and eliminated in 2001.
(10) Shares outstanding for each of the years presented gives effect to a 2-for-1 stock split effectuated by us in the form of a 100% stock dividend distributed on January 2, 2004.
(11) Inventory turnover is calculated as cost of sales divided by the average of beginning and ending inventories. The fiscal 2003 cost of sales excludes the effect of the 53rd
week in the amount of $34.3 million. The fiscal 2001 amounts were calculated by reducing the Discount inventory balances by one-thirteenth to reflect our ownership of
that inventory from December 2, 2001 (the acquisition date) through December 29, 2001.
(12) Inventory per store calculated as ending inventory divided by ending store count. Ending inventory used in this calculation excludes certain inventory related to the
wholesale segment with the exception of fiscal 2003.
(13) Accounts payable to inventory ratio is calculated as ending accounts payable divided by ending inventory.
(14) Net working capital is calculated by subtracting current liabilities from current assets.
(15) Capital expenditures for 2001 exclude $34.1 million for our November 2001 purchase of Discount’s Gallman, Mississippi distribution facility from the lessor in
connection with the Discount acquisition.
(16) Net debt includes total debt and bank overdrafts, less cash and cash equivalents.
(17) Comparable store sales is calculated based on the change in net sales starting once a store has been open for 13 complete accounting periods (each period represents four
weeks). Relocations are included in comparable store sales from the original date of opening. Stores acquired in the Discount acquisition are included in the comparable
sales calculation beginning in December 2002, which was 13 complete accounting periods after the acquisition date of November 28, 2001. We do not include net sales
from the 36 Western Auto retail stores in our comparable store calculation as a result of their unique product offerings, including specialty merchandise and service. In
2003, the comparable store sales calculation included sales from our 53rd week compared to our first week of operation in 2003 (the comparable calendar week).
(18) Closed stores in 2002 include 133 Discount and Advance stores closed as part of the integration of Discount.
(19) Average net sales per store is calculated as net sales divided by the average of beginning and ending number of stores for the respective period. The fiscal 2003 net sales
exclude the effect of the 53rd week in the amount of $63.0 million. The fiscal 2001 amounts were calculated by reducing the number of Discount stores by one-thirteenth
to reflect our ownership of Discount from December 2, 2001 (the acquisition date) through December 29, 2001.
(20) Average net sales per square foot is calculated as net sales divided by the average of the beginning and ending total store square footage for the respective period. The
fiscal 2003 net sales exclude the effect of the 53rd week in the amount of $63.0 million. The fiscal 2001 amounts were calculated by reducing the number of Discount
stores by one-thirteenth to reflect our ownership of Discount from December 2, 2001 (the acquisition date) through December 29, 2001.
Page 11
Advance Auto Parts, Inc. and Subsidiaries