Abercrombie & Fitch 2013 Annual Report Download - page 65
Download and view the complete annual report
Please find page 65 of the 2013 Abercrombie & Fitch annual report below. You can navigate through the pages in the report by either clicking on the pages listed below, or by using the keyword search tool below to find specific information within the annual report.-
 1
1 -
2
-
3
-
4
-
5
-
6
-
7
-
8
-
9
-
10
-
11
-
12
-
13
-
14
-
15
-
16
-
17
-
18
-
19
-
20
-
21
-
22
-
23
-
24
-
25
-
26
-
27
-
28
-
29
-
30
-
31
-
32
-
33
-
34
-
35
-
36
-
37
-
38
-
39
-
40
-
41
-
42
-
43
-
44
-
45
-
46
-
47
-
48
-
49
-
50
-
51
-
52
-
53
-
54
-
 55
55 -
 56
56 -
 57
57 -
 58
58 -
 59
59 -
 60
60 -
 61
61 -
 62
62 -
 63
63 -
 64
64 -
 65
65 -
 66
66 -
 67
67 -
 68
68 -
 69
69 -
 70
70 -
 71
71 -
 72
72 -
 73
73 -
 74
74 -
 75
75 -
76
-
77
-
78
-
79
-
80
-
81
-
82
-
83
-
84
-
85
-
86
-
87
-
88
-
89
-
90
-
91
-
92
-
93
-
94
-
95
-
96
-
97
-
98
-
99
-
100
-
101
-
102
-
103
-
104
-
105
-
106
-
107
-
108
-
109
-
110
-
111
-
112
-
113
-
114
-
115
-
116
 |
 |
65
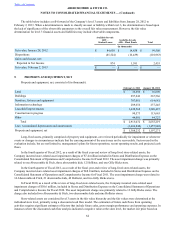
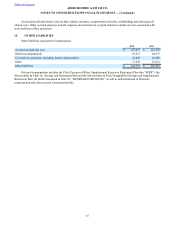
historical experience was used to determine the fair value by asset type. Included in property and equipment, net, are store-
related assets previously impaired and measured at a fair value of $10.2 million and $13.1 million, net of accumulated
depreciation, as of February 2, 2013 and January 28, 2012, respectively.
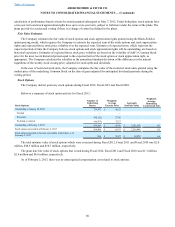
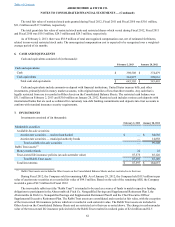
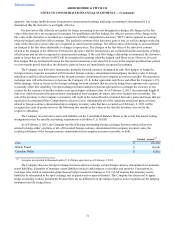
The following table presents quantitative information related to the unobservable inputs used in the Company's level 3
fair value measurements for the impairment loss incurred in Fiscal 2012.
UNOBSERVABLE INPUT VALUE
Weighted average cost of capital (1) 12%
Annual revenue growth rates (2) 2%
(1) The Company utilized the year-end weighted average cost of capital in the discounted cash flow model.
(2) The Company utilized an annual revenue growth rate in the discounted cash flow model.
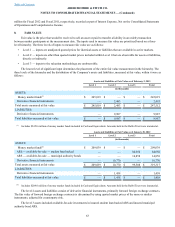
In certain lease arrangements, the Company is involved with the construction of the building. If the Company determines
that it has substantially all of the risks of ownership during construction of the leased property and therefore is deemed to be the
owner of the construction project, the Company records an asset for the amount of the total project costs and an amount related
to the value attributed to the pre-existing leased building in Property and Equipment, Net and the related financing obligation in
Leasehold Financing Obligations on the Consolidated Balance Sheets. Once construction is complete, the Company determines
if the asset qualifies for sale-leaseback accounting treatment. If the arrangement does not qualify for sale-lease back treatment,
the Company continues to depreciate the asset over its useful life. The Company had $55.2 million and $47.5 million of
construction project assets in Property and Equipment, Net at February 2, 2013 and January 28, 2012, respectively.
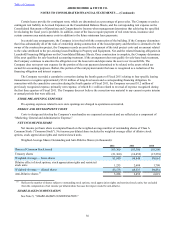
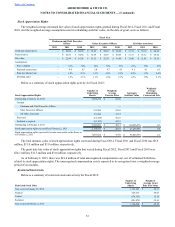
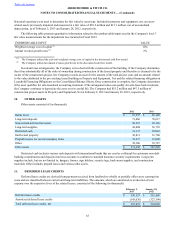
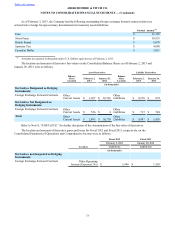
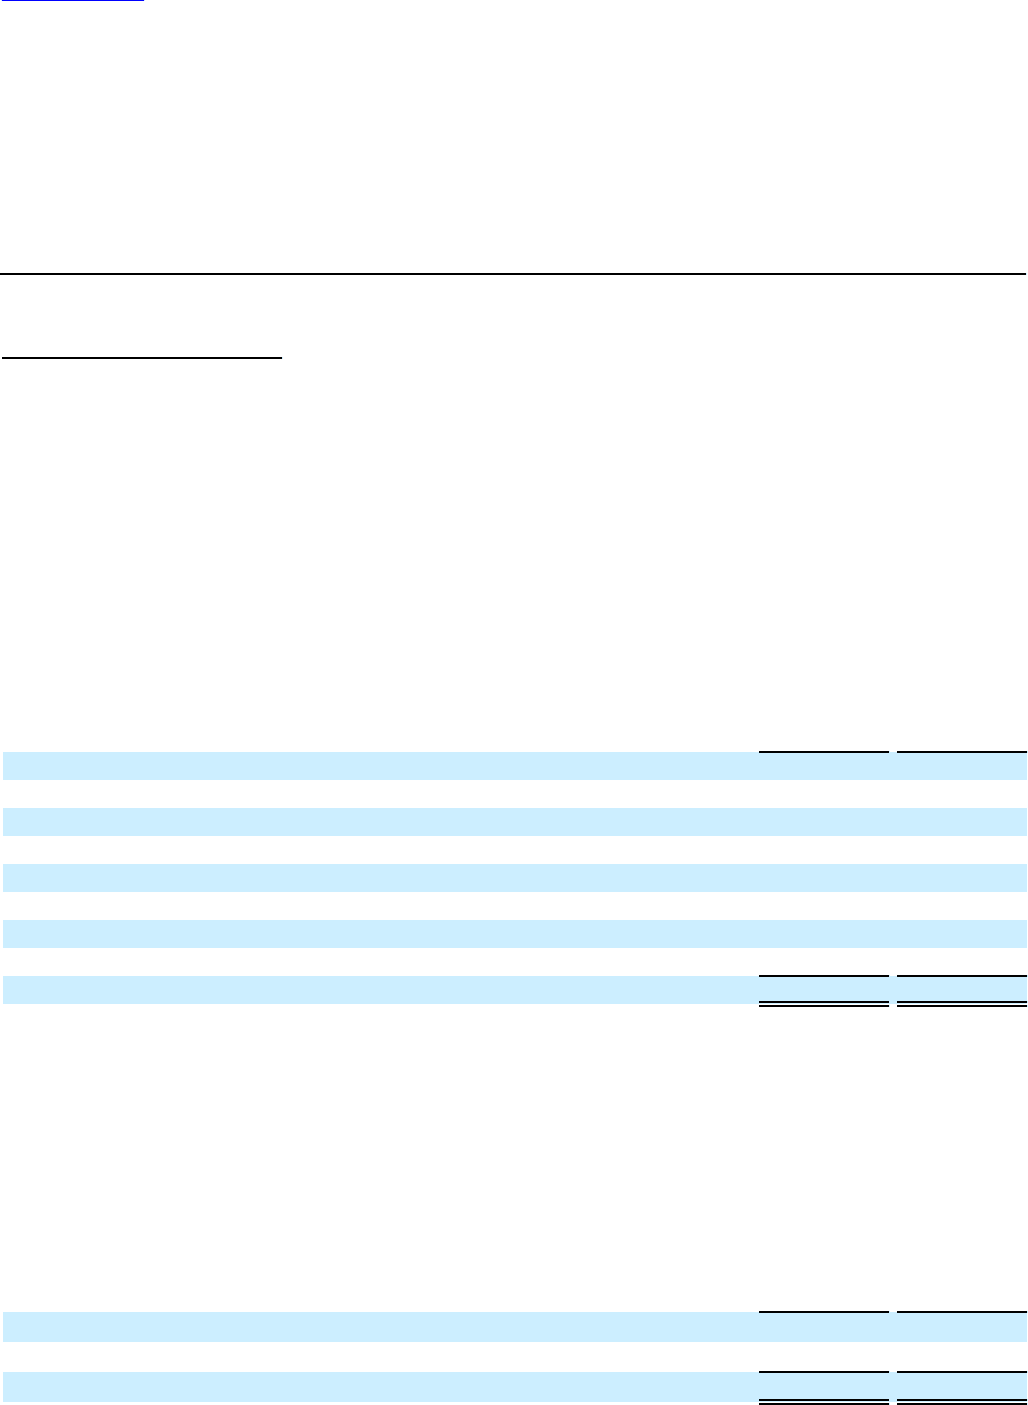
10. OTHER ASSETS
Other assets consisted of (in thousands):
2012 2011
Rabbi Trust $ 87,597 $ 85,149
Long-term deposits 71,486 78,617
Non-current deferred tax assets 50,387 29,165
Long-term supplies 42,404 36,739
Restricted cash 31,137 30,043
Intellectual property 30,811 31,760
Prepaid income tax on intercompany items 19,217 16,049
Other 38,306 39,727
Other assets $ 371,345 $ 347,249
Restricted cash includes various cash deposits with international banks that are used as collateral for customary non-debt
banking commitments and deposits into trust accounts to conform to standard insurance security requirements. Long-term
supplies include, but are not limited to, hangers, frames, sign holders, security tags, back-room supplies, and construction
materials. Other includes prepaid leases and various other assets.
11. DEFERRED LEASE CREDITS
Deferred lease credits are derived from payments received from landlords to wholly or partially offset store construction
costs and are classified between current and long-term liabilities. The amounts, which are amortized as a reduction of rent
expense over the respective lives of the related leases, consisted of the following (in thousands):
February 2,
2013 January 28,
2012
Deferred lease credits $ 550,527 $ 551,468
Amortized deferred lease credits (343,076)(327,399)
Total deferred lease credits, net $ 207,451 $ 224,069
Table of Contents ABERCROMBIE & FITCH CO.
NOTES TO CONSOLIDATED FINANCIAL STATEMENTS — (Continued)