Abercrombie & Fitch 2013 Annual Report Download - page 49
Download and view the complete annual report
Please find page 49 of the 2013 Abercrombie & Fitch annual report below. You can navigate through the pages in the report by either clicking on the pages listed below, or by using the keyword search tool below to find specific information within the annual report.-
 1
1 -
2
-
3
-
4
-
5
-
6
-
7
-
8
-
9
-
10
-
11
-
12
-
13
-
14
-
15
-
16
-
17
-
18
-
19
-
20
-
21
-
22
-
23
-
24
-
25
-
26
-
27
-
28
-
29
-
30
-
31
-
32
-
33
-
34
-
35
-
36
-
37
-
38
-
 39
39 -
 40
40 -
 41
41 -
 42
42 -
 43
43 -
 44
44 -
 45
45 -
 46
46 -
 47
47 -
 48
48 -
 49
49 -
 50
50 -
 51
51 -
 52
52 -
 53
53 -
 54
54 -
 55
55 -
 56
56 -
 57
57 -
 58
58 -
 59
59 -
60
-
61
-
62
-
63
-
64
-
65
-
66
-
67
-
68
-
69
-
70
-
71
-
72
-
73
-
74
-
75
-
76
-
77
-
78
-
79
-
80
-
81
-
82
-
83
-
84
-
85
-
86
-
87
-
88
-
89
-
90
-
91
-
92
-
93
-
94
-
95
-
96
-
97
-
98
-
99
-
100
-
101
-
102
-
103
-
104
-
105
-
106
-
107
-
108
-
109
-
110
-
111
-
112
-
113
-
114
-
115
-
116
 |
 |

49
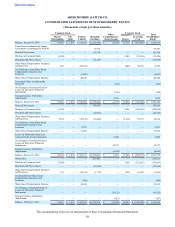
ABERCROMBIE & FITCH CO.
CONSOLIDATED STATEMENTS OF CASH FLOWS
(Thousands)
2012 2011 2010
(Restated see Note 4)
OPERATING ACTIVITIES:
Net Income $ 237,011 $ 143,934 $ 155,709
Impact of Other Operating Activities on Cash Flows:
Depreciation and Amortization 224,245 232,956 229,153
Non-Cash Charge for Asset Impairment 7,407 68,022 50,631
Loss on Disposal / Write-off of Assets 11,866 22,460 7,064
Lessor Construction Allowances 22,522 41,509 35,281
Amortization of Deferred Lease Credits (45,942)(48,258)(48,373)
Deferred Taxes (21,543)(31,252)(28,001)
Share-Based Compensation 52,922 51,093 40,599
Tax Benefit (Deficiency) from Share-Based Compensation (466) 2,973 (1,053)
Excess Tax Benefit from Share-Based Compensation (1,198)(4,821) —
Auction Rate Securities (Gain) Loss (2,454) 13,442 —
Changes in Assets and Liabilities:
Inventories 253,650 (216,133)(79,869)
Accounts Payable and Accrued Expenses (34,692) 130,180 27,108
Income Taxes 37,628 4,754 63,807
Other Assets and Liabilities (56,785)(45,640)(60,267)
NET CASH PROVIDED BY OPERATING ACTIVITIES 684,171 365,219 391,789
INVESTING ACTIVITIES:
Capital Expenditures (339,862)(318,598)(160,935)
Purchase of Trust-Owned Life Insurance Policies — — (16,583)
Proceeds from Sales of Marketable Securities 101,963 2,650 84,542
Other Investing (9,339)(24,741) —
NET CASH USED FOR INVESTING ACTIVITIES (247,238)(340,689)(92,976)
FINANCING ACTIVITIES:
Proceeds from Share-Based Compensation 2,676 46,530 13,941
Excess Tax Benefit from Share Based Compensation 1,198 4,821 —
Proceeds from Borrowings under Credit Agreement 135,000 — —
Repayment of Borrowings under Credit Agreement (135,000)(45,002)(12,093)
Purchase of Common Stock (321,665)(196,605)(76,158)
Dividends Paid (57,634)(60,956)(61,656)
Change in Outstanding Checks and Other (4,646)(14,117)(9,367)
NET CASH USED FOR FINANCING ACTIVITIES (380,071)(265,329)(145,333)
EFFECT OF EXCHANGE RATES ON CASH 3,148 (2,059) 2,923
NET INCREASE (DECREASE) IN CASH AND EQUIVALENTS: 60,010 (242,858) 156,403
Cash and Equivalents, Beginning of Period 583,495 826,353 669,950
CASH AND EQUIVALENTS, END OF PERIOD $ 643,505 $ 583,495 $ 826,353
SIGNIFICANT NON-CASH INVESTING ACTIVITIES:
Change in Accrual for Construction in Progress $ (12,919) $ 23,040 $ 18,741
The accompanying Notes are an integral part of these Consolidated Financial Statements.
Table of Contents