Abercrombie & Fitch 2013 Annual Report Download - page 61
Download and view the complete annual report
Please find page 61 of the 2013 Abercrombie & Fitch annual report below. You can navigate through the pages in the report by either clicking on the pages listed below, or by using the keyword search tool below to find specific information within the annual report.-
 1
1 -
2
-
3
-
4
-
5
-
6
-
7
-
8
-
9
-
10
-
11
-
12
-
13
-
14
-
15
-
16
-
17
-
18
-
19
-
20
-
21
-
22
-
23
-
24
-
25
-
26
-
27
-
28
-
29
-
30
-
31
-
32
-
33
-
34
-
35
-
36
-
37
-
38
-
39
-
40
-
41
-
42
-
43
-
44
-
45
-
46
-
47
-
48
-
49
-
50
-
 51
51 -
 52
52 -
 53
53 -
 54
54 -
 55
55 -
 56
56 -
 57
57 -
 58
58 -
 59
59 -
 60
60 -
 61
61 -
 62
62 -
 63
63 -
 64
64 -
 65
65 -
 66
66 -
 67
67 -
 68
68 -
 69
69 -
 70
70 -
 71
71 -
72
-
73
-
74
-
75
-
76
-
77
-
78
-
79
-
80
-
81
-
82
-
83
-
84
-
85
-
86
-
87
-
88
-
89
-
90
-
91
-
92
-
93
-
94
-
95
-
96
-
97
-
98
-
99
-
100
-
101
-
102
-
103
-
104
-
105
-
106
-
107
-
108
-
109
-
110
-
111
-
112
-
113
-
114
-
115
-
116
 |
 |
61
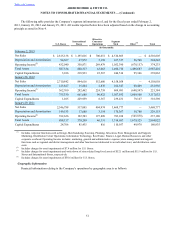
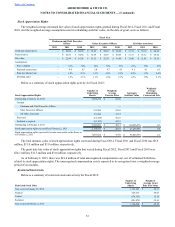
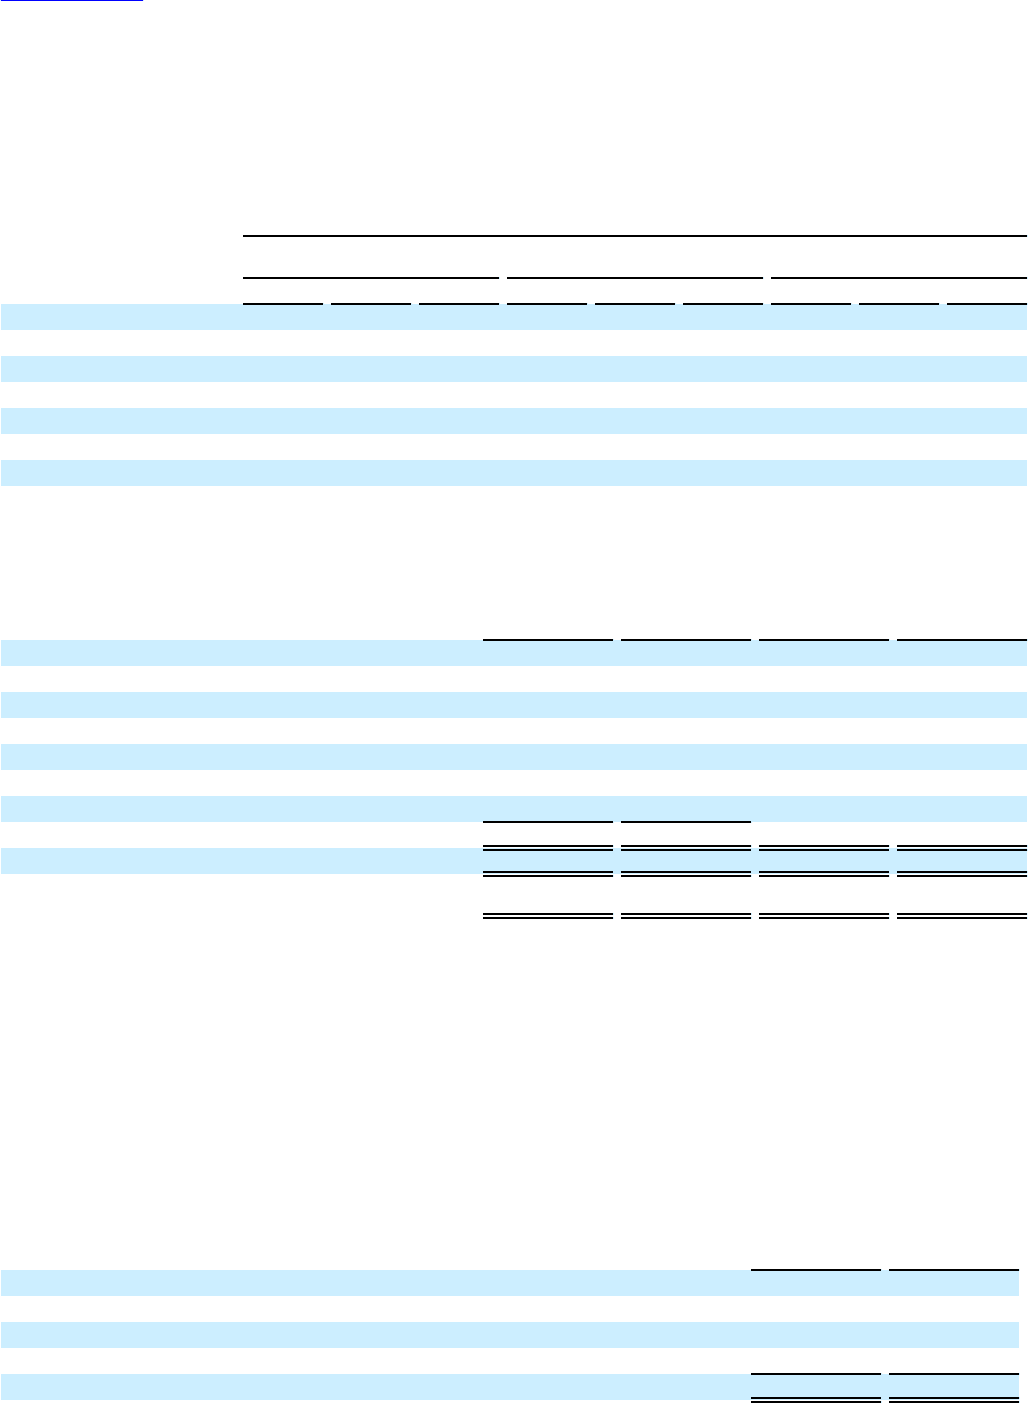
Stock Appreciation Rights
The weighted-average estimated fair value of stock appreciation rights granted during Fiscal 2012, Fiscal 2011 and Fiscal
2010, and the weighted-average assumptions used in calculating such fair value, on the date of grant, were as follows:
Fiscal Year
Chairman and Chief Executive
Officer Other Executive Officers All Other Associates
2012 2011 2010 2012 2011 2010 2012 2011 2010
Grant date market price — $ 56.86 $ 44.86 $ 52.89 $ 54.87 $ 44.86 $ 51.31 $ 55.12 $ 44.32
Exercise price — $ 56.86 $ 44.86 $ 52.89 $ 54.87 $ 44.86 $ 51.31 $ 55.12 $ 44.32
Fair value — $ 22.99 $ 16.96 $ 23.53 $ 22.29 $ 16.99 $ 21.90 $ 21.98 $ 16.51
Assumptions:
Price volatility — 53% 50% 56% 53% 51% 61% 55% 53%
Expected term (years) — 4.6 4.7 5.0 4.7 4.5 4.1 4.1 4.1
Risk-free interest rate — 1.8% 2.3% 1.3% 2.0% 2.3% 0.9% 1.7% 2.0%
Dividend yield — 1.5% 2.1% 1.1% 1.6% 2.1% 1.2% 1.6% 2.1%
Below is a summary of stock appreciation rights activity for Fiscal 2012:
Stock Appreciation Rights
Number of
Underlying
Shares
Weighted-
Average
Exercise Price Aggregate
Intrinsic Value
Weighted-
Average
Remaining
Contractual Life
Outstanding at January 28, 2012 9,039,334 $ 39.66
Granted:
Chairman and Chief Executive Officer — —
Other Executive Officers 212,500 52.89
All Other Associates 151,300 51.31
Exercised (63,150) 30.27
Forfeited or expired (93,125) 44.61
Outstanding at February 2, 2013 9,246,859 $ 40.17 $ 114,456,670 4.3
Stock appreciation rights exercisable at February 2, 2013 2,134,871 $ 42.55 $ 21,259,648 4.8
Stock appreciation rights expected to become exercisable in the future as
of February 2, 2013 7,057,622 $ 39.38 $ 93,026,530 4.1
The total intrinsic value of stock appreciation rights exercised during Fiscal 2012, Fiscal 2011 and Fiscal 2010 was $0.9
million, $11.0 million and $1.8 million, respectively.
The grant date fair value of stock appreciation rights that vested during Fiscal 2012, Fiscal 2011 and Fiscal 2010 was
$24.1 million, $11.3 million and $5.0 million, respectively.
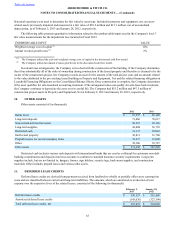
As of February 2, 2013, there was $41.6 million of total unrecognized compensation cost, net of estimated forfeitures,
related to stock appreciation rights. The unrecognized compensation cost is expected to be recognized over a weighted-average
period of six months.
Restricted Stock Units
Below is a summary of restricted stock unit activity for Fiscal 2012:
Restricted Stock Units
Number of
Underlying
Shares
Weighted-
Average Grant
Date Fair Value
Non-vested at January 28, 2012 1,189,292 $ 49.11
Granted 625,615 48.07
Vested (374,352) 52.18
Forfeited (241,875) 52.82
Non-vested at February 2, 2013 1,198,680 $ 46.88
Table of Contents ABERCROMBIE & FITCH CO.
NOTES TO CONSOLIDATED FINANCIAL STATEMENTS — (Continued)