Abercrombie & Fitch 2013 Annual Report Download - page 60
Download and view the complete annual report
Please find page 60 of the 2013 Abercrombie & Fitch annual report below. You can navigate through the pages in the report by either clicking on the pages listed below, or by using the keyword search tool below to find specific information within the annual report.-
 1
1 -
2
-
3
-
4
-
5
-
6
-
7
-
8
-
9
-
10
-
11
-
12
-
13
-
14
-
15
-
16
-
17
-
18
-
19
-
20
-
21
-
22
-
23
-
24
-
25
-
26
-
27
-
28
-
29
-
30
-
31
-
32
-
33
-
34
-
35
-
36
-
37
-
38
-
39
-
40
-
41
-
42
-
43
-
44
-
45
-
46
-
47
-
48
-
49
-
 50
50 -
 51
51 -
 52
52 -
 53
53 -
 54
54 -
 55
55 -
 56
56 -
 57
57 -
 58
58 -
 59
59 -
 60
60 -
 61
61 -
 62
62 -
 63
63 -
 64
64 -
 65
65 -
 66
66 -
 67
67 -
 68
68 -
 69
69 -
 70
70 -
71
-
72
-
73
-
74
-
75
-
76
-
77
-
78
-
79
-
80
-
81
-
82
-
83
-
84
-
85
-
86
-
87
-
88
-
89
-
90
-
91
-
92
-
93
-
94
-
95
-
96
-
97
-
98
-
99
-
100
-
101
-
102
-
103
-
104
-
105
-
106
-
107
-
108
-
109
-
110
-
111
-
112
-
113
-
114
-
115
-
116
 |
 |

60
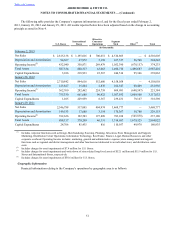
satisfaction of performance-based criteria for awards granted subsequent to May 7, 2012. Under both plans, stock options have
a ten-year term and stock appreciation rights have up to a ten-year term, subject to forfeiture under the terms of the plans. The
plans provide for accelerated vesting if there is a change of control as defined in the plans.
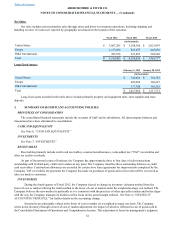
Fair Value Estimates
The Company estimates the fair value of stock options and stock appreciation rights granted using the Black-Scholes
option-pricing model, which requires the Company to estimate the expected term of the stock options and stock appreciation
rights and expected future stock price volatility over the expected term. Estimates of expected terms, which represent the
expected periods of time the Company believes stock options and stock appreciation rights will be outstanding, are based on
historical experience. Estimates of expected future stock price volatility are based on the volatility of A&F’s Common Stock
price for the most recent historical period equal to the expected term of the stock option or stock appreciation right, as
appropriate. The Company calculates the volatility as the annualized standard deviation of the differences in the natural
logarithms of the weekly stock closing price, adjusted for stock splits and dividends.
In the case of restricted stock units, the Company calculates the fair value of the restricted stock units granted using the
market price of the underlying Common Stock on the date of grant adjusted for anticipated dividend payments during the
vesting period.
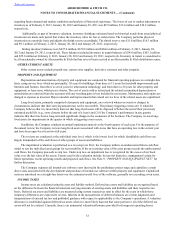
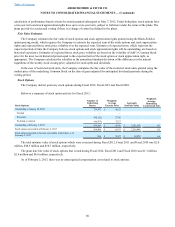
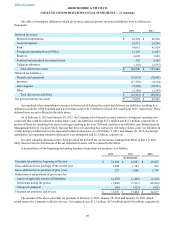
Stock Options
The Company did not grant any stock options during Fiscal 2012, Fiscal 2011 and Fiscal 2010.
Below is a summary of stock option activity for Fiscal 2012:
Stock Options
Number of
Underlying
Shares
Weighted-
Average
Exercise Price Aggregate
Intrinsic Value
Weighted-
Average
Remaining
Contractual Life
Outstanding at January 28, 2012 714,997 $ 60.72
Granted — —
Exercised (99,122) 27.02
Forfeited or expired (46,475) 75.27
Outstanding at February 2, 2013 569,400 $ 65.40 $ 2,282,298 4.3
Stock options exercisable at February 2, 2013 568,400 $ 65.47 $ 2,254,098 4.3
Stock options expected to become exercisable in the future as of
February 2, 2013 996 $ 22.87 $ 28,078 6.0
The total intrinsic value of stock options which were exercised during Fiscal 2012, Fiscal 2011 and Fiscal 2010 was $2.0
million, $48.5 million and $10.7 million, respectively.
The grant date fair value of stock options that vested during Fiscal 2012, Fiscal 2011 and Fiscal 2010 was $1.3 million,
$2.4 million and $4.0 million, respectively.
As of February 2, 2013, there was no unrecognized compensation cost related to stock options.
Table of Contents ABERCROMBIE & FITCH CO.
NOTES TO CONSOLIDATED FINANCIAL STATEMENTS — (Continued)