Abercrombie & Fitch 2013 Annual Report Download - page 36
Download and view the complete annual report
Please find page 36 of the 2013 Abercrombie & Fitch annual report below. You can navigate through the pages in the report by either clicking on the pages listed below, or by using the keyword search tool below to find specific information within the annual report.-
 1
1 -
2
-
3
-
4
-
5
-
6
-
7
-
8
-
9
-
10
-
11
-
12
-
13
-
14
-
15
-
16
-
17
-
18
-
19
-
20
-
21
-
22
-
23
-
24
-
25
-
 26
26 -
 27
27 -
 28
28 -
 29
29 -
 30
30 -
 31
31 -
 32
32 -
 33
33 -
 34
34 -
 35
35 -
 36
36 -
 37
37 -
 38
38 -
 39
39 -
 40
40 -
 41
41 -
 42
42 -
 43
43 -
 44
44 -
 45
45 -
 46
46 -
47
-
48
-
49
-
50
-
51
-
52
-
53
-
54
-
55
-
56
-
57
-
58
-
59
-
60
-
61
-
62
-
63
-
64
-
65
-
66
-
67
-
68
-
69
-
70
-
71
-
72
-
73
-
74
-
75
-
76
-
77
-
78
-
79
-
80
-
81
-
82
-
83
-
84
-
85
-
86
-
87
-
88
-
89
-
90
-
91
-
92
-
93
-
94
-
95
-
96
-
97
-
98
-
99
-
100
-
101
-
102
-
103
-
104
-
105
-
106
-
107
-
108
-
109
-
110
-
111
-
112
-
113
-
114
-
115
-
116
 |
 |

36
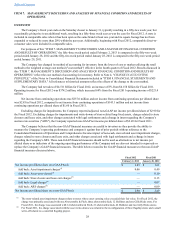
Liquidity and Capital Resources
Historical Sources and Uses of Cash
Seasonality of Cash Flows
The retail business has two principal selling seasons: the Spring season which includes the first and second fiscal quarters
(“Spring”) and the Fall season which includes the third and fourth fiscal quarters (“Fall”). As is typical in the apparel industry,
the Company experiences its greatest sales activity during the Fall season due to Back-to-School and Holiday sales periods,
particularly in the U.S. The Company relies on excess operating cash flows, which are largely generated in the Fall season, to
fund operating expenses throughout the year and to reinvest in the business to support future growth. The Company also has a
credit facility and the term loan agreement available as sources of additional funding.
Credit Agreements
On July 28, 2011, the Company entered into an unsecured amended and restated credit agreement (the “Amended and
Restated Credit Agreement”) under which up to $350 million is available. The Amended and Restated Credit Agreement served
to amend and restate, in its entirety, the credit agreement dated April 15, 2008 as previously amended (the “Prior Credit
Agreement”). The primary reasons for entering into the Amended and Restated Credit Agreement were to extend the
termination date from April 12, 2013 to July 27, 2016 and to reduce fees and interest rates.
As of March 22, 2013, the Company had approximately $350 million available under the Amended and Restated Credit
Agreement. The Company had no borrowings outstanding under the Amended and Restated Credit Agreement on February 2,
2013.
On February 24, 2012, the Company entered into a $300 million Term Loan Agreement to increase its flexibility and
liquidity. On January 23, 2013, the Company amended both the Amended and Restated Credit Agreement and Term Loan
Agreement to reduce the amount available for borrowing under the Term Loan Agreement to $150 million and lower the
applicable Coverage Ratio to 1.75 to 1.00. In addition, the Amended and Restated Credit Agreement and the Term Loan
Agreement both have a Leverage Ratio. The Company was in compliance with the applicable ratio requirements and other
covenants at February 2, 2013. Subsequent to year end, the Company drew down the full $150 million available under the Term
Loan Agreement.
The Amended and Restated Credit Agreement and the Term Loan Agreement, including the material covenants which
apply to each, are described in Note 16, “BORROWINGS,” of the Notes to Consolidated Financial Statements included in
"ITEM 8. FINANCIAL STATEMENTS AND SUPPLEMENTARY DATA," of this Annual Report on Form 10-K.
Stand-by letters of credit outstanding as of February 2, 2013 and January 28, 2012 were immaterial.
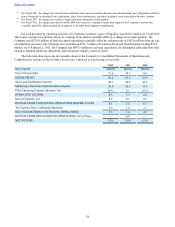
Operating Activities
Net cash provided by operating activities was $684.2 million for Fiscal 2012 compared to $365.2 million for Fiscal 2011.
The increase in cash provided by operating activities was primarily driven by a change in inventories partially offset by a
change in accounts payable.
Investing Activities
Cash outflows for investing activities for Fiscal 2012 and Fiscal 2011 were used primarily for capital expenditures related
to new store construction and information technology investments. Cash outflows for capital expenditures were consistent from
Fiscal 2012 and Fiscal 2011. In Fiscal 2012, cash flows for investing activities included proceeds received from sales of
marketable securities.
Financing Activities
For Fiscal 2012 and Fiscal 2011, cash outflows for financing activities consisted primarily of the repurchase of A&F’s
Common Stock and the payment of dividends. For Fiscal 2011, net cash outflows related to the repurchase of A&F's Common
Stock, payment of dividends and the repayment of borrowings under the then existing credit agreement were partially offset by
the receipt of proceeds associated with the exercise of share-based compensation awards.
During Fiscal 2012, A&F repurchased approximately 7.5 million shares of A&F’s Common Stock in the open market
with a market value of approximately $321.7 million. During Fiscal 2011, A&F repurchased approximately 3.5 million shares
of A&F’s Common Stock in the open market with a market value of $196.6 million. During Fiscal 2010, A&F repurchased
approximately 1.6 million shares of A&F’s Common Stock in the open market with a market value of $76.2 million. Fiscal
2012, Fiscal 2011 and Fiscal 2010 repurchases were pursuant to the authorizations of A&F's Board of Directors.
As of February 2, 2013, A&F had approximately 18.7 million remaining shares available for repurchase as part of the
A&F Board of Directors’ previously approved authorizations.
Table of Contents