Abercrombie & Fitch 2013 Annual Report Download - page 34
Download and view the complete annual report
Please find page 34 of the 2013 Abercrombie & Fitch annual report below. You can navigate through the pages in the report by either clicking on the pages listed below, or by using the keyword search tool below to find specific information within the annual report.-
 1
1 -
2
-
3
-
4
-
5
-
6
-
7
-
8
-
9
-
10
-
11
-
12
-
13
-
14
-
15
-
16
-
17
-
18
-
19
-
20
-
21
-
22
-
23
-
 24
24 -
 25
25 -
 26
26 -
 27
27 -
 28
28 -
 29
29 -
 30
30 -
 31
31 -
 32
32 -
 33
33 -
 34
34 -
 35
35 -
 36
36 -
 37
37 -
 38
38 -
 39
39 -
 40
40 -
 41
41 -
 42
42 -
 43
43 -
 44
44 -
45
-
46
-
47
-
48
-
49
-
50
-
51
-
52
-
53
-
54
-
55
-
56
-
57
-
58
-
59
-
60
-
61
-
62
-
63
-
64
-
65
-
66
-
67
-
68
-
69
-
70
-
71
-
72
-
73
-
74
-
75
-
76
-
77
-
78
-
79
-
80
-
81
-
82
-
83
-
84
-
85
-
86
-
87
-
88
-
89
-
90
-
91
-
92
-
93
-
94
-
95
-
96
-
97
-
98
-
99
-
100
-
101
-
102
-
103
-
104
-
105
-
106
-
107
-
108
-
109
-
110
-
111
-
112
-
113
-
114
-
115
-
116
 |
 |

34
believes it is more likely than not that the net deferred tax assets will be realized, it is not certain. Should circumstances change,
the net deferred tax assets not currently subject to a valuation allowance may become subject to one in the future. Additional
valuation allowances would result in additional tax expense.
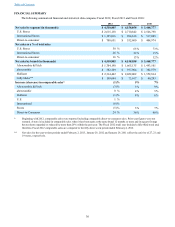
Net Income and Net Income per Diluted Share
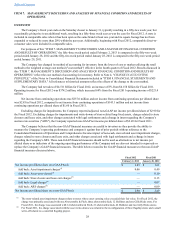
Net income for Fiscal 2012 was $237.0 million compared to net income of $143.9 million for Fiscal 2011. Net income
per diluted share for Fiscal 2012 was $2.85 compared to net income per diluted share of $1.61 for Fiscal 2011. Net income per
diluted share for Fiscal 2012 included store-related asset impairment charges of approximately $0.06 per diluted share. Net
income per diluted share for Fiscal 2011 included store-related asset impairment charges of approximately $0.49 per diluted
share, asset write-down charges of approximately $0.10 per diluted share, store closure and exit charges of approximately $0.13
per diluted share, legal charges of approximately $0.07 per diluted share, and other-than-temporary impairment charges of
approximately $0.09 per diluted share related to a change in intent regarding the Company’s ARS portfolio. Refer to the GAAP
reconciliation table in the “OVERVIEW” section of this “ITEM 7. MANAGEMENT’S DISCUSSION AND ANALYSIS OF
FINANCIAL CONDITION AND RESULTS OF OPERATIONS” for a reconciliation of net income per diluted share on a
GAAP basis to net income per diluted share on a non-GAAP basis, excluding charges for impairment and write-downs of store
related long-lived assets, charges related to store closures and lease exits, and other charges associated with legal settlements
and with a change in intent regarding the Company’s ARS.
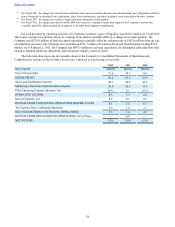
FISCAL 2011 COMPARED TO FISCAL 2010
Net Sales
Net sales for Fiscal 2011 were $4.158 billion, an increase of 20% from Fiscal 2010 net sales of $3.469 billion. The net
sales increase was attributable to new stores, primarily international, a 5% increase in comparable store sales, and a 36%
increase in the direct-to-consumer business, including shipping and handling revenue. The impact of foreign currency on sales
(based on converting prior year sales at current year exchange rates) for Fiscal 2011 and Fiscal 2010 was a benefit of $21.6
million and $4.9 million, respectively.
Total Company U.S. store sales for Fiscal 2011 were $2.711 billion, an increase of 6% from Fiscal 2010 sales of $2.547
billion. Total Company international store sales for Fiscal 2011 were $894.6 million, an increase of 73% from Fiscal 2010 sales
of $517.0 million.
Direct-to-consumer sales in Fiscal 2011, including shipping and handling revenue, were $552.6 million, an increase of
36% from Fiscal 2010 direct-to-consumer sales of $405.0 million. The direct-to-consumer business, including shipping and
handling revenue, accounted for 13% of total net sales in Fiscal 2011 compared to 12% in Fiscal 2010.
Comparable store sales by brand for Fiscal 2011 were as follows: Abercrombie & Fitch increased 3%, with men’s and
women’s increasing by a low single digit percent. abercrombie kids increased 4%, with guys increasing by a high single digit
and girls increasing by a low single digit. Hollister increased 8%, with dudes and bettys increasing by a high single digit.
On a comparable store sales basis, the Southern and the Western regions of the U.S. were the strongest performing
regions, while Canada and Japan were the weakest.
From a merchandise classification standpoint, fleece, active wear, and knit tops were stronger performing categories for
the male business while graphics and woven shirts were weaker performing categories. In the female business, woven shirts,
sweaters, and knit tops were stronger performing categories, while graphics and dresses were weaker performing categories.
Gross Profit
Gross profit during Fiscal 2011 was $2.550 billion compared to gross profit of $2.217 billion during Fiscal 2010. The
gross profit rate for Fiscal 2011 was 61.3%, down 260 basis points from the Fiscal 2010 rate of 63.9%.
The decrease in the gross profit rate for Fiscal 2011 was primarily driven by an increase in average unit cost.
Stores and Distribution Expense
Stores and distribution expense for Fiscal 2011 was $1.888 billion compared to $1.590 billion in Fiscal 2010. The stores
and distribution expense rate for Fiscal 2011 was 45.4% compared to 45.8% in Fiscal 2010.
Stores and distribution expense for Fiscal 2011 included store-related asset impairment charges of $68.0 million
associated with 79 stores, asset write-down charges of $14.6 million related to the reconfiguration of three flagship stores and a
small write-off related to a cancelled flagship project, and store exit charges of $19.0 million, associated with lease buyouts and
other lease obligations related to stores closing prior to natural lease expirations, other lease terminations, and other incidental
costs associated with store closures. For Fiscal 2010, stores and distribution expense included store-related asset impairment
Table of Contents