Abercrombie & Fitch 2013 Annual Report Download - page 29
Download and view the complete annual report
Please find page 29 of the 2013 Abercrombie & Fitch annual report below. You can navigate through the pages in the report by either clicking on the pages listed below, or by using the keyword search tool below to find specific information within the annual report.-
 1
1 -
2
-
3
-
4
-
5
-
6
-
7
-
8
-
9
-
10
-
11
-
12
-
13
-
14
-
15
-
16
-
17
-
18
-
 19
19 -
 20
20 -
 21
21 -
 22
22 -
 23
23 -
 24
24 -
 25
25 -
 26
26 -
 27
27 -
 28
28 -
 29
29 -
 30
30 -
 31
31 -
 32
32 -
 33
33 -
 34
34 -
 35
35 -
 36
36 -
 37
37 -
 38
38 -
 39
39 -
40
-
41
-
42
-
43
-
44
-
45
-
46
-
47
-
48
-
49
-
50
-
51
-
52
-
53
-
54
-
55
-
56
-
57
-
58
-
59
-
60
-
61
-
62
-
63
-
64
-
65
-
66
-
67
-
68
-
69
-
70
-
71
-
72
-
73
-
74
-
75
-
76
-
77
-
78
-
79
-
80
-
81
-
82
-
83
-
84
-
85
-
86
-
87
-
88
-
89
-
90
-
91
-
92
-
93
-
94
-
95
-
96
-
97
-
98
-
99
-
100
-
101
-
102
-
103
-
104
-
105
-
106
-
107
-
108
-
109
-
110
-
111
-
112
-
113
-
114
-
115
-
116
 |
 |
29
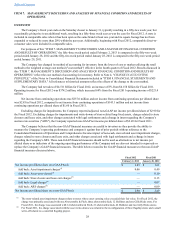
(3) For Fiscal 2011, the charges for store closures and lease exits were associated with lease buyouts and other lease obligations related to
stores closing prior to natural lease expirations, other lease terminations, and other incidental costs associated with store closures.
(4) For Fiscal 2011, the charge was related to legal settlements during the fourth quarter.
(5) For Fiscal 2011, the charge associated with the ARS was related to a change in intent with regard to the Company’s auction rate
securities portfolio, which resulted in recognition of an other-than-temporary impairment.
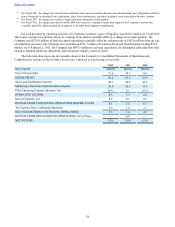
Net cash provided by operating activities, the Company’s primary source of liquidity, was $684.2 million for Fiscal 2012.
This source of cash was primarily driven by a change in inventories partially offset by a change in accounts payable. The
Company used $339.9 million of cash for capital expenditures partially offset by cash proceeds of $102.0 million from the sale
of marketable securities. The Company also repurchased $321.7 million of Common Stock and paid dividends totaling $57.6
million. As of February 2, 2013, the Company had $643.5 million in cash and equivalents, no outstanding debt aside from that
related to landlord financing obligations, and immaterial stand-by letters of credit.
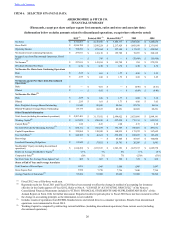
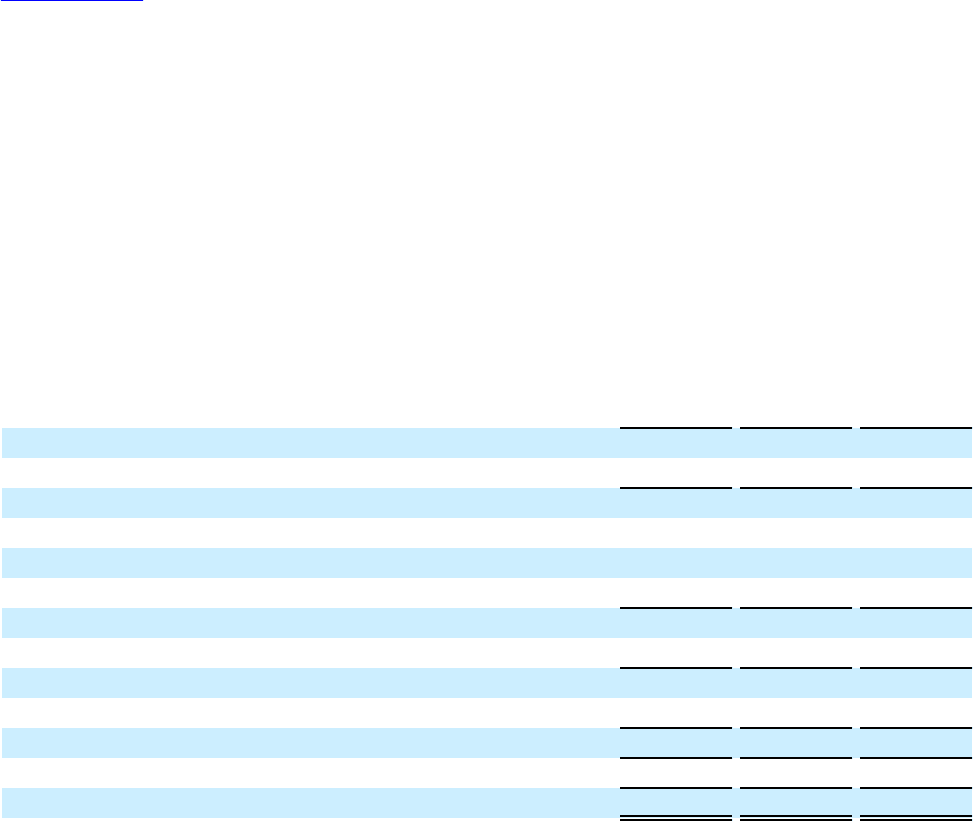
The following data represents the amounts shown in the Company’s Consolidated Statements of Operations and
Comprehensive Income for the last three fiscal years, expressed as a percentage of net sales:
2012 2011 2010
NET SALES 100.0% 100.0% 100.0%
Cost of Goods Sold 37.6 38.7 36.1
GROSS PROFIT 62.4 61.3 63.9
Stores and Distribution Expense 44.1 45.4 45.8
Marketing, General and Administrative Expense 10.5 10.5 11.6
Other Operating Expense (Income), Net (0.4) 0.1 (0.3)
OPERATING INCOME 8.3 5.3 6.8
Interest Expense, Net 0.2 0.1 0.1
INCOME FROM CONTINUING OPERATIONS BEFORE TAXES 8.1 5.2 6.7
Tax Expense from Continuing Operations 2.9 1.8 2.3
NET INCOME FROM CONTINUING OPERATIONS 5.3 3.4 4.5
INCOME FROM DISCONTINUED OPERATIONS, Net of Taxes — 0.0 —
NET INCOME 5.3% 3.5% 4.5%
Table of Contents