Abercrombie & Fitch 2013 Annual Report Download - page 35
Download and view the complete annual report
Please find page 35 of the 2013 Abercrombie & Fitch annual report below. You can navigate through the pages in the report by either clicking on the pages listed below, or by using the keyword search tool below to find specific information within the annual report.-
 1
1 -
2
-
3
-
4
-
5
-
6
-
7
-
8
-
9
-
10
-
11
-
12
-
13
-
14
-
15
-
16
-
17
-
18
-
19
-
20
-
21
-
22
-
23
-
24
-
 25
25 -
 26
26 -
 27
27 -
 28
28 -
 29
29 -
 30
30 -
 31
31 -
 32
32 -
 33
33 -
 34
34 -
 35
35 -
 36
36 -
 37
37 -
 38
38 -
 39
39 -
 40
40 -
 41
41 -
 42
42 -
 43
43 -
 44
44 -
 45
45 -
46
-
47
-
48
-
49
-
50
-
51
-
52
-
53
-
54
-
55
-
56
-
57
-
58
-
59
-
60
-
61
-
62
-
63
-
64
-
65
-
66
-
67
-
68
-
69
-
70
-
71
-
72
-
73
-
74
-
75
-
76
-
77
-
78
-
79
-
80
-
81
-
82
-
83
-
84
-
85
-
86
-
87
-
88
-
89
-
90
-
91
-
92
-
93
-
94
-
95
-
96
-
97
-
98
-
99
-
100
-
101
-
102
-
103
-
104
-
105
-
106
-
107
-
108
-
109
-
110
-
111
-
112
-
113
-
114
-
115
-
116
 |
 |

35
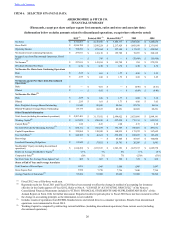
charges associated with 26 stores of $50.6 million and store exit charges of $4.4 million associated with the closure of 64
domestic stores during the year.
The decrease in stores and distribution expense rate for Fiscal 2011 was primarily driven by lower store occupancy costs
as a percentage of net sales.
Shipping and handling costs, including costs incurred to store, move and prepare the products for shipment and costs
incurred to physically move the product to the customer, associated with direct-to-consumer operations were $53.6 million and
$38.9 million for Fiscal 2011 and Fiscal 2010, respectively. Handling costs, including costs incurred to store, move and prepare
the products for shipment to the stores were $62.8 million and $42.8 million for Fiscal 2011 and Fiscal 2010, respectively.
These amounts are recorded in Stores and Distribution Expense in our Consolidated Statements of Operations and
Comprehensive Income.
Marketing, General and Administrative Expense
Marketing, general and administrative expense during Fiscal 2011 was $437.1 million compared to $400.8 million in
Fiscal 2010. For Fiscal 2011, the marketing, general and administrative expense rate was 10.5%, compared to 11.6% for Fiscal
2010. Marketing, general and administrative expense for Fiscal 2011 included $10.0 million in connection with legal
settlements.
In addition to legal settlement charges, the increase in marketing, general and administrative expense for Fiscal 2011 was
primarily due to increases in compensation, including equity compensation, outside services, marketing, travel and IT expenses.
Other Operating Expense (Income), Net
Other operating expense, net was $3.5 million for Fiscal 2011 compared to other operating income, net of $10.1 million
for Fiscal 2010. Other operating expense, net for Fiscal 2011, included $13.4 million of expense related to a change in the
Company’s intent regarding the sale of its ARS portfolio, which resulted in recognition of an other-than-temporary impairment
in Fiscal 2011.
Interest Expense (Income), Net and Tax Expense
Fiscal 2011 interest expense was $7.9 million, offset by interest income of $4.3 million, compared to interest expense of
$7.8 million, offset by interest income of $4.4 million for Fiscal 2010.
The effective tax rate for Fiscal 2011 was 34.3% compared to 33.4% for Fiscal 2010.
As of January 28, 2012, there were approximately $25.6 million of net deferred tax assets in Japan with a valuation
allowance of $2.4 million. The valuation allowance in Japan was established as the result of changes to the business
configuration of operations in Japan, as well as tax law changes. The realization of the net deferred tax assets not subject to a
valuation allowance is dependent upon the future generation of sufficient profits in Japan. While the Company believes it is
more likely than not that the net deferred tax assets will be realized, it is not certain. Should circumstances change, some or all
of the net deferred tax assets not currently subject to a valuation allowance may become so in the future. Any increase in the
valuation allowance would result in additional tax expense.
Income from Discontinued Operations, Net of Tax
The Company completed the closure of its RUEHL branded stores and related direct-to-consumer operations in the fourth
quarter of Fiscal 2009. Accordingly, the after-tax operating results appear in Income (Loss) from Discontinued Operations, Net
of Tax on the Consolidated Statements of Operations and Comprehensive Income. Results from discontinued operations, net of
tax, were immaterial for Fiscal 2010.
Refer to Note 19, “DISCONTINUED OPERATIONS,” of the Notes to Consolidated Financial Statements included in
“ITEM 8. FINANCIAL STATEMENTS AND SUPPLEMENTARY DATA” of this Annual Report on Form 10-K for further
discussion.
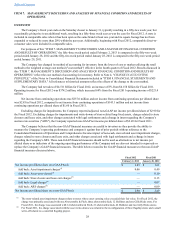
Net Income and Net Income per Diluted Share
Net income for Fiscal 2011 was $143.9 million compared to $155.7 million for Fiscal 2010. Net income per diluted share
for Fiscal 2011 was $1.61 compared to $1.73 for Fiscal 2010. Net income per diluted share for Fiscal 2011 included store-
related asset impairment charges of approximately $0.49 per diluted share, asset write-down charges of approximately $0.10
per diluted share, store closure and exit charges of approximately $0.13 per diluted share, legal charges of approximately $0.07
per diluted share, and other-than-temporary impairment charges of approximately $0.09 per diluted share related to a change in
intent regarding the Company’s ARS portfolio. Net income per diluted share for Fiscal 2010 included store-related asset
impairment charges of approximately $0.34 per diluted share and store exit charges of approximately $0.03 per diluted share.
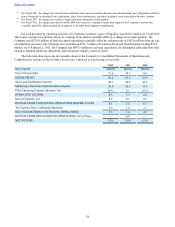
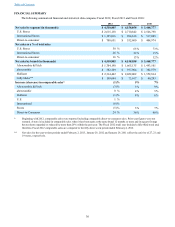
FINANCIAL CONDITION
Table of Contents